- Local time
- Today, 19:10
- Joined
- Jul 9, 2003
- Messages
- 17,145
Excel in Access (Part 2)
Unfortunately photobucket have decided to shove all of their pictures behind a paywall rendering this blog practically useless! I have a copy of it on my website which I have kept up to date you can find it here:- http://www.niftyaccess.com/excel-in-access/excel-in-access-part-2/
Excel in Access (Part 1)
Excel in Access (Part 3)
Video Version HERE:
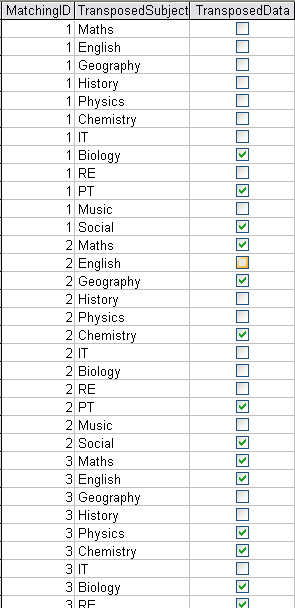
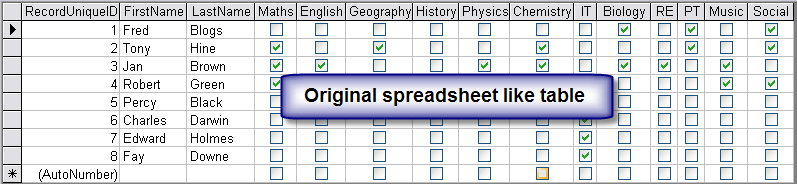
In Excel in Access (Part 1), we went from this:

To this:
This was achieved with a form based tool available to DOWNLOAD here.
See instructions on its use here:
However you may be looking at the new resultant table and wondering what on earth to do with it. I hope to take you through the process of making it into something useful in this thread.
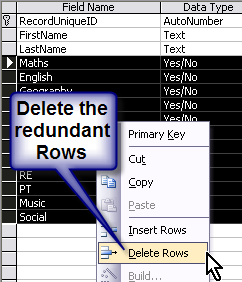
The first thing you will notice is that where the check box is not checked, then that whole row is redundant, for instance there’s no need to record that ID number “1” --- “Has Not” taken Maths, English, Geography, Physics etc, it would suffice just to record the subjects that have been taken , In this case Biology, PT and Social. Looking at those entries in particular, then a general rule of logic can be defined, “delete all the rows where the check boxes are false”.
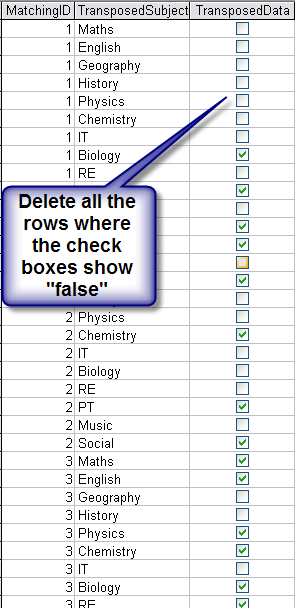
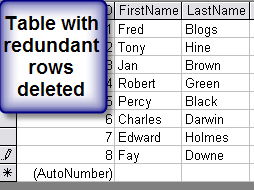
Once you have deleted all of those rows,
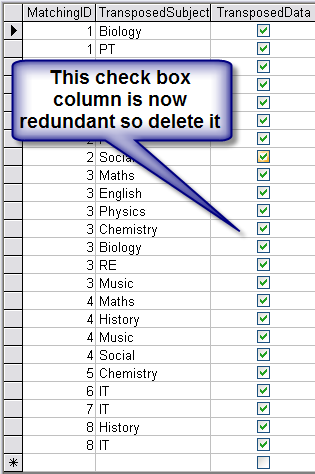
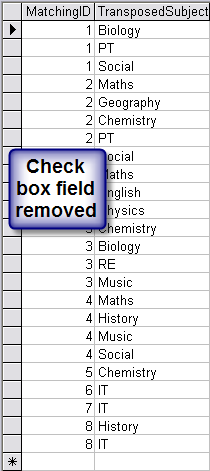
then it becomes obvious that the check boxes themselves which now “All” contain a true value are also redundant, they can be deleted just leaving you the text entry identifying the subject taken by each student.
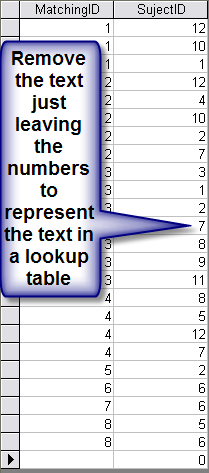
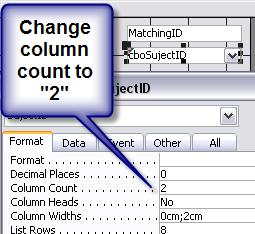
Using the “relational” properties of the database that is one more thing you can do which will improve efficiency and that is to replace each text entry --- Maths, English, Geography, Physics etc, with a number linking that field to a look up table.
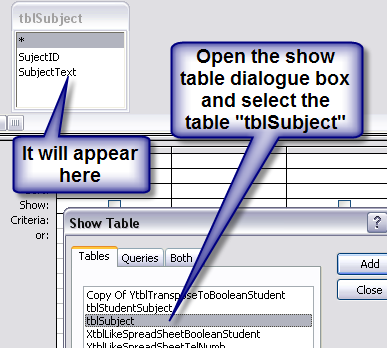
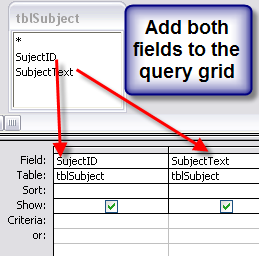
First of all you need to create a look up table; this can be done by applying a create table query to extract just the unique values for the “subject” There is a video showing how to do this here: (At time index 1min)
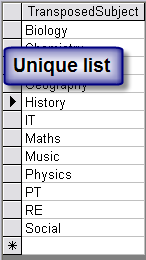
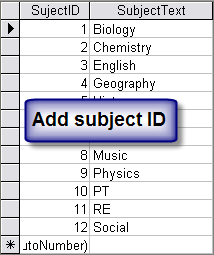
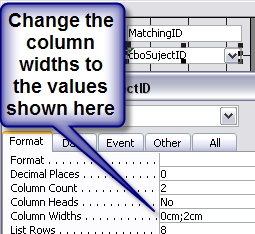
This unique list should be called “tblSubject” this table is not quite finished, you need to add an identity column to the left of the text representing the individual subject, this identity will then appear in the previous table.
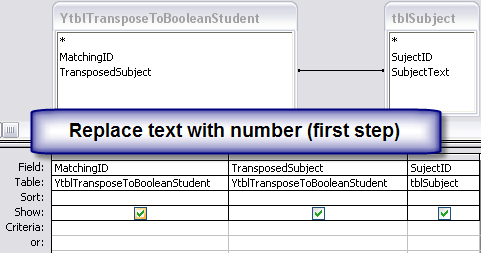
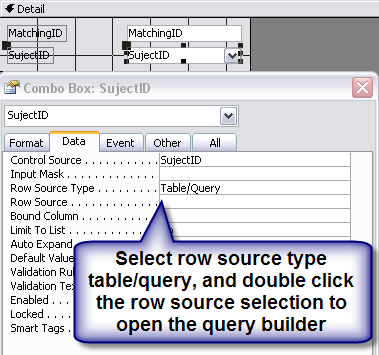
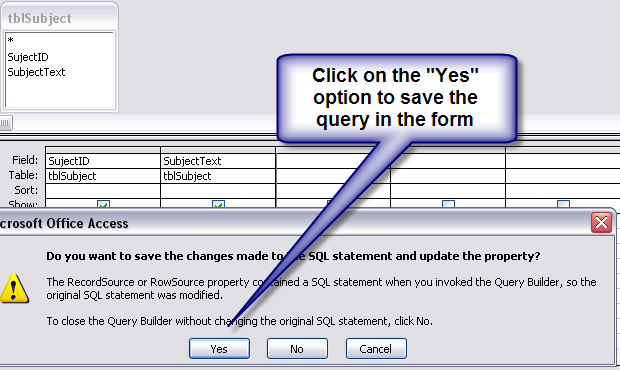
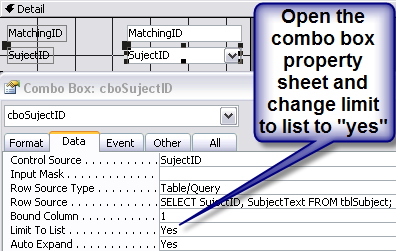
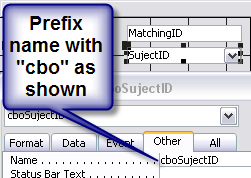
Once you have completed the “look up table” you then need to replace the entries in the student subject table “tblStudentSubject” where it shows subject in text form with the number representing the link to the look up table. This is the query:
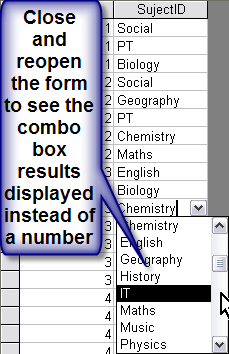
And here is the new column created:
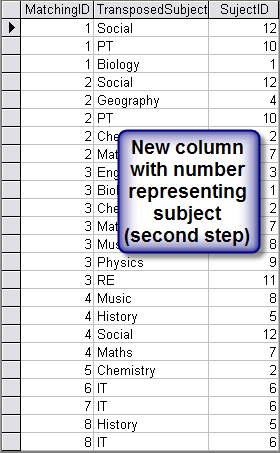
This way your design changes to the table are making it much more efficient, holding the same information but with less data.
Unfortunately photobucket have decided to shove all of their pictures behind a paywall rendering this blog practically useless! I have a copy of it on my website which I have kept up to date you can find it here:- http://www.niftyaccess.com/excel-in-access/excel-in-access-part-2/
Excel in Access (Part 1)
Excel in Access (Part 3)
Video Version HERE:
In Excel in Access (Part 1), we went from this:
To this:
This was achieved with a form based tool available to DOWNLOAD here.
See instructions on its use here:
However you may be looking at the new resultant table and wondering what on earth to do with it. I hope to take you through the process of making it into something useful in this thread.
The first thing you will notice is that where the check box is not checked, then that whole row is redundant, for instance there’s no need to record that ID number “1” --- “Has Not” taken Maths, English, Geography, Physics etc, it would suffice just to record the subjects that have been taken , In this case Biology, PT and Social. Looking at those entries in particular, then a general rule of logic can be defined, “delete all the rows where the check boxes are false”.
Once you have deleted all of those rows,
then it becomes obvious that the check boxes themselves which now “All” contain a true value are also redundant, they can be deleted just leaving you the text entry identifying the subject taken by each student.
Using the “relational” properties of the database that is one more thing you can do which will improve efficiency and that is to replace each text entry --- Maths, English, Geography, Physics etc, with a number linking that field to a look up table.
First of all you need to create a look up table; this can be done by applying a create table query to extract just the unique values for the “subject” There is a video showing how to do this here: (At time index 1min)
This unique list should be called “tblSubject” this table is not quite finished, you need to add an identity column to the left of the text representing the individual subject, this identity will then appear in the previous table.
Once you have completed the “look up table” you then need to replace the entries in the student subject table “tblStudentSubject” where it shows subject in text form with the number representing the link to the look up table. This is the query:
And here is the new column created:
This way your design changes to the table are making it much more efficient, holding the same information but with less data.
Last edited:
")