Format line in "compound" chart (1 Viewer)

Big Pat

Registered User.
Local time
Today, 21:49
Joined
Sep 29, 2004
Messages
555
Hi,
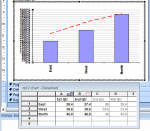
When you create a column chart and then change one of the series to a line, how can you then apply formatting to that line?

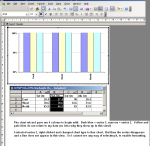
I've attached a stripped down database showing what I'm trying to do. Series 1 shows individual monthly values (percentages) and series 2 shows the target which is 80% for each month.

The problem is that although I can apply formatting to the column series, I can't see any way of selecting the line series so I can set the formatting I want.

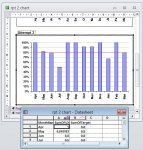
I've also attached a picture showing where I got to in the chart screen - if that helps at all!

I'm using Access 2003, on Win XP Professional, in case that's important.

Been banging my head on that brick wall for hours now, :banghead: so I'd love some help.

Pat.
 

Attachments

  • Chart problem.mdb
    312 KB · Views: 93
  • Chart formatting.PNG
    Chart formatting.PNG
    48.4 KB · Views: 141

JHB

Have been here a while
Local time
Today, 22:49
Joined
Jun 17, 2012
Messages
7,732
Open "rpt 2 chart" in Report view and the save the database, then your data should be shown when you open the report in design afterwards, (then you can change the line formatting).
 

Attachments

  • rpt 2 chart.jpg
    rpt 2 chart.jpg
    97 KB · Views: 387

Big Pat

Registered User.
Local time
Today, 21:49
Joined
Sep 29, 2004
Messages
555
Thanks for your suggestion JHB. I did get it to work - eventually!!! - but there's still something I don't understand.

I noticed in your picture that while you are formatting the chart, you can see the columns as they will appear in report view and your data table also displays the ACTUAL data. But I still see columns labelled East, West, North, and fake/sample data in the table. See attached (never figured out how to put an image in the message body.)

I suddenly realised the reason I could not see the line was because I had set the scale min-max to 0-1 (so I can format it 0% to 100%.) However, the fake data meant my line was off the scale. I reset the scale to 5000% and then I could see the line, so I formatted it and then reset the scale max to 1. And this works!!

OK so that's a workaround, but I must be missing a step somewhere. What do I click to see the real data while formatting and not East West North etc? I rarely use charts in Access reports and I remember having this problem before.

Thanks so much for your help!

Pat.
 

Attachments

  • New screenshot.png
    New screenshot.png
    19 KB · Views: 130

JHB

Have been here a while
Local time
Today, 22:49
Joined
Jun 17, 2012
Messages
7,732
Thanks for your suggestion JHB. I did get it to work - eventually!!! - but there's still something I don't understand.

I noticed in your picture that while you are formatting the chart, you can see the columns as they will appear in report view and your data table also displays the ACTUAL data. But I still see columns labelled East, West, North, and fake/sample data in the table. See attached (never figured out how to put an image in the message body.)
Open "rpt 2 chart" in Report view and the save the database, then your data should be shown when you open the report in design afterwards
If not helps, move something a little in design view, then show it in "Report View" and close the report, save it when you are asked. Maybe you need to do it 2-3 times, (remember to move something), yes I know it sound silly but ... :)
 

Users who are viewing this thread

Top Bottom