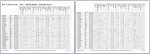
You mean something like this?
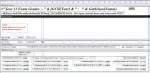
Here is the design so you can see what I've put where
NOTE: There are in fact 60 column headers but placed one on top of the other in the design
When the report is opened inprint preview, the number of columns is calculated & the column headers placed accordingly
Any empty columns are not displayed (i.e. if there are less than 60 columns worth of data)
If you need to do so, column headings can be specified in one of 2 ways:
a) using fixed headings specified in the property sheet - e.g. "Jan", "Feb" etc
b) using dynamic crosstab report code where the columns are adapted to fit the current data