RussellDeano
Registered User.
- Local time
- Today, 07:03
- Joined
- Aug 19, 2017
- Messages
- 22
Morning all,
Again apologies for my inexperience in advance.
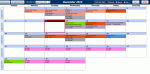
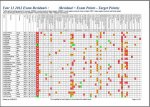
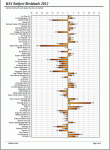
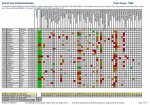
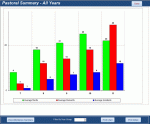
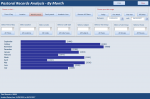
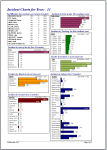
I have four charts for my database where users input information about incidents at work.
1. Incidents by day of the week (to identify risk periods)
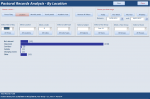
2. Incidents by location
3. Incidents by timeslot
4. Incidents by type
The database now holds 18 months worth of data and therefore the charts are becoming a little difficult to analyse as trends may have changed over time.
I would like to do one of two things.
1. Create a graph that could be filtered to contain all of the above
or
2. Add a simple date between option on a form for each chart and have the chart on a subform? (I believe this is how it should be done?)
Unfortunately i do not use code and this is my first database so i am learning as i go, from here and youtube videos! But i cannot find an easy step by step guide on how to do this. Any help would be greatly appreciated.
I have added as many images as i can to hopefully evidence what i am saying.
Again apologies for my inexperience in advance.
I have four charts for my database where users input information about incidents at work.
1. Incidents by day of the week (to identify risk periods)
2. Incidents by location
3. Incidents by timeslot
4. Incidents by type
The database now holds 18 months worth of data and therefore the charts are becoming a little difficult to analyse as trends may have changed over time.
I would like to do one of two things.
1. Create a graph that could be filtered to contain all of the above
or
2. Add a simple date between option on a form for each chart and have the chart on a subform? (I believe this is how it should be done?)
Unfortunately i do not use code and this is my first database so i am learning as i go, from here and youtube videos! But i cannot find an easy step by step guide on how to do this. Any help would be greatly appreciated.
I have added as many images as i can to hopefully evidence what i am saying.
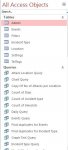
Attachments
-
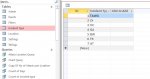
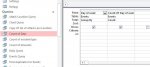
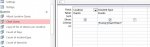 Chart Query.JPG32.1 KB · Views: 141
 -
 Database names.JPG32.2 KB · Views: 118
 -
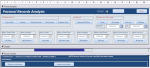
 Incident list.JPG34.2 KB · Views: 123
 -
 Incident type chart.JPG69.5 KB · Views: 120
 -
 Incidents by day.JPG37.9 KB · Views: 118
")