Dear all,
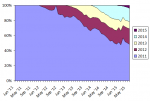
I am currently working on making an automatic report for my boss in which I must see whether new products really sell. So I have already done some work and I have figured out that I can make a graph like in the attachment. It is done by creating the graph with sales in the y axis, period in the x-axis and with the introduction date grouped by Year.
My boss was wondering if it is possible to make some grouping, where that you can set your own filter date, so making such figures with data points before and after a certain date filtered. I have searched and searched, but I cannot find it... The ultimate goal is that it can read the filter date from the report and can set it automatically.
Thank you for your time!
I am currently working on making an automatic report for my boss in which I must see whether new products really sell. So I have already done some work and I have figured out that I can make a graph like in the attachment. It is done by creating the graph with sales in the y axis, period in the x-axis and with the introduction date grouped by Year.
My boss was wondering if it is possible to make some grouping, where that you can set your own filter date, so making such figures with data points before and after a certain date filtered. I have searched and searched, but I cannot find it...
The ultimate goal is that it can read the filter date from the report and can set it automatically.Thank you for your time!
Attachments
-
 Capture.PNG12.5 KB · Views: 99