Multiple List Boxes controlling query (1 Viewer)

10kz

Registered User.
Local time
Yesterday, 23:08
Joined
Jan 9, 2017
Messages
21
I've attached a copy of a early build of a dashboard I'm trying to create.

What I am trying to do:

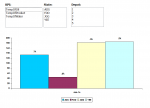
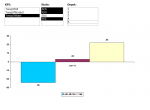
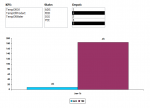
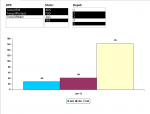
There are 3 list boxes that change the output of the graph below it after each selection. The VBA I have at the moment works well for the first list box but I'm finding it difficult to add in the 2 others.

The logic is straight forward, if no selection is made on any of the list boxes then leave it as a all (*) value however if a or many selections are made in a single box then have these filter the table.

I've attached a copy of the example code I mentioned.
 

Attachments

  • Database501.zip
    760 KB · Views: 60

pbaldy

Wino Moderator
Staff member
Local time
Yesterday, 23:08
Joined
Aug 30, 2003
Messages
36,131
If I'm understanding right build 3 different criteria strings and then:

"WHERE tblData.kpi IN(" & strCriteria & ") AND SecondField IN(" & SecondVariable & ") AND ThirdField IN(" & ThirdVariable & ")"

You'd have to account for selections not being made in any given listbox by leaving it out of the string.
 

10kz

Registered User.
Local time
Yesterday, 23:08
Joined
Jan 9, 2017
Messages
21
Why cant a * option be a default if nothing is selected, along the lines of this:

"WHERE tblData.kpi IN(" & strCriteria OR * & ") AND SecondField IN(" & SecondVariable OR * & ") AND ThirdField IN(" & ThirdVariable OR * & ")"
 

pbaldy

Wino Moderator
Staff member
Local time
Yesterday, 23:08
Joined
Aug 30, 2003
Messages
36,131
I don't think a wildcard will work without Like, but you can try it.
 

isladogs

MVP / VIP
Local time
Today, 07:08
Joined
Jan 14, 2017
Messages
18,207
Hi

I looked at this and felt your code was unnecessarily complex.
I hope you don't mind that I have rewritten the code the way I normally do it.

That is building up the SQL for the chart using
Code:
strSQL = strSelect & strWhere & strGroupBy & strOrderBy

In your case, I've left out strOrderBy as you weren't using it

I believe its what you were trying to achieve...
See screenshots as examples

The form opens with the data unfiltered i.e. strWhere = ""

Each listbox adds to the strWhere clause as filters are applied
At each change, a routine GetRecordSource updates strSQL for the chart

I've also modified the vertical scale to show integers but you can change it back if you prefer.
 

Attachments

  • Unfiltered.PNG
    Unfiltered.PNG
    18.6 KB · Views: 60
  • Filter_KPI&State.PNG
    Filter_KPI&State.PNG
    14.6 KB · Views: 70
  • FilterDepot.PNG
    FilterDepot.PNG
    14.3 KB · Views: 59
  • FiltersKPI&State&Depot.PNG
    FiltersKPI&State&Depot.PNG
    15.5 KB · Views: 61
  • Database501 - UPDATED - CR.accdb
    640 KB · Views: 57

10kz

Registered User.
Local time
Yesterday, 23:08
Joined
Jan 9, 2017
Messages
21
Spot on Ridders! It works exactly as it should. The only change I'll make is to the kpi.depot (3rd list)

I'll set listDepot_AfterUpdate() to build a string that updates the chart to show KPI by depot number instead of state.
 

isladogs

MVP / VIP
Local time
Today, 07:08
Joined
Jan 14, 2017
Messages
18,207
You're welcome
I did wonder about that myself but that wasn't what you said in your post.

The code can be adapted to any type of chart
 

Users who are viewing this thread

Top Bottom