Improve query structure (1 Viewer)

Roger9

New member
Local time
Yesterday, 23:49
Joined
Aug 7, 2019
Messages
7
I have two tables: logger_data and MPCable. Logger_data table has hourly gage data records consisting of columns for site_serial (unique for each gage), date-time, water pressure (ch1_data_P), barometric pressure (ch2_data_P), temperature, and other not so very important data. MPCable table has information of cable length (for each site_serial) required for calculating water levels at each gage. The hourly data in logger table is not perfect, has several values that are outside acceptable data range for each gage. I want a final table that would have daily average water level records for each gage. When averaging water levels for each day, I want the query to exclude out-of-range values. Each gage has different acceptable range. I designed an insert query using a combination of IIf and SWITCH function. The logger data table gets updated with new data in every 2-3 days and I want to run this query to add the new average data into "Combined" table with desired output. Here's the query I have designed in SQL:
Code:
INSERT INTO Combined ( [Date], site_serial, CountyID, CompWL, Count_WL )
SELECT Format([Date_time],"mm/dd/yyyy") AS [Date], logger_data.site_serial, MPCable.CountyID, Switch([logger_data]![site_serial]=9100001,(Avg([MPC]-[MPH]-([ch1_data_P]-2.307*(IIf((([ch2_data_P]>=13.93) And ([ch2_data_P]<=15.36)),[ch2_data_P],Null))))),[logger_data]![site_serial]=9100002,(Avg([MPC]-[MPH]-([ch1_data_P]-2.307*(IIf((([ch2_data_P]>=13.79) And ([ch2_data_P]<=15.15)),[ch2_data_P],Null))))),[logger_data]![site_serial]=9100003,(Avg([MPC]-[MPH]-([ch1_data_P]-2.307*(IIf((([ch2_data_P]>=13.71) And ([ch2_data_P]<=15.06)),[ch2_data_P],Null))))),[logger_data]![site_serial]=9100004,(Avg([MPC]-[MPH]-([ch1_data_P]-2.307*(IIf((([ch2_data_P]>=13.91) And ([ch2_data_P]<=15.26)),[ch2_data_P],Null))))),[logger_data]![site_serial]=9100005,(Avg([MPC]-[MPH]-([ch1_data_P]-2.307*(IIf((([ch2_data_P]>=13.81) And ([ch2_data_P]<=15.17)),[ch2_data_P],Null))))),[logger_data]![site_serial]=9100006,(Avg([MPC]-[MPH]-([ch1_data_P]-2.307*(IIf((([ch2_data_P]>=13.7) And ([ch2_data_P]<=15.3)),[ch2_data_P],Null))))),[logger_data]![site_serial]=9100007,(Avg([MPC]-[MPH]-([ch1_data_P]-2.307*(IIf((([ch2_data_P]>=13.5) And ([ch2_data_P]<=14.84)),[ch2_data_P],Null))))),[logger_data]![site_serial]=9100008,(Avg([MPC]-[MPH]-([ch1_data_P]-2.307*(IIf((([ch2_data_P]>=13.94) And ([ch2_data_P]<=15.33)),[ch2_data_P],Null))))),[logger_data]![site_serial]=9100009,(Avg([MPC]-[MPH]-([ch1_data_P]-2.307*(IIf((([ch2_data_P]>=13.7) And ([ch2_data_P]<=15.3)),[ch2_data_P],Null)))))) AS CompWL, Count(logger_data.ch1_data_P) AS Count_WL
FROM logger_data INNER JOIN MPCable ON logger_data.site_serial = MPCable.site_serial
GROUP BY Format([Date_time],"mm/dd/yyyy"), logger_data.site_serial, MPCable.CountyID;

Initially I used nested IIf's but it gave complexity error after 8 statements. So I am now using SWITCH instead (Still using IIf to specify acceptable data range values for each gage). Couple of questions now:
1. The designed query structure is very basic and has room for improvements. How can I make it more simplified?
2. The designed query is working great for the 9 gage stations. But if I were to add in more statements for more gages in the future, will it create any complexity problem (similar to using too many nested IIf statements)?
3. The designed query is giving desired results but duplicating records of daily average values for every gage (sometimes 2, sometimes 4-5 same rows). Not that it's a problem as such, but it will be great if I can avoid the duplicate values if using the above designed query. Also why in the first place running that query gives duplicates?
 
Last edited:

jdraw

Super Moderator
Staff member
Local time
Today, 02:49
Joined
Jan 23, 2006
Messages
15,380
Why exactly would you exclude recordings outside your "acceptable range"?
I suggest you review Normalization. There are several articles and videos available for free on the internet.

I recommend that you describe in plain English -separate from database terms and jargon- what it is you are trying to accomplish. Forum members can advise accordingly once they understand the business issue and requirements.
A description sufficient to satisfy a question from someone in the McDonalds line up who doesn't know database, never heard of MS Access and doesn't know you or your environment. The question may be a simple as --" so, what are you doing at work?"

Good luck. You know the issue and context, we don't.
 

Roger9

New member
Local time
Yesterday, 23:49
Joined
Aug 7, 2019
Messages
7
Okay, I can understand! I'll try to give a simple explanation. I simply want to calculate daily average water levels from the hourly records for each measuring site. About the "acceptable data range", the device that measures atmospheric pressure (barologger) can sometimes give a bad data value. It could be a human error or sometimes just the device itself acting funny. As the atmospheric pressure data is used to calculate water levels, any wrong hourly measurement can screw up the calculated daily average water level. So, let's say for a measuring site the water level normally ranges between 20-25 feet, but for some reason we are getting 145 ft. We know this is not natural. Also, the bad data could sometimes be close to the above-mentioned acceptable range. That’s why I have designed the query that will only use the hourly records within the required range and would leave a blank row if there’s multiple days of bad data. That way I can go back to the original data and figure out if the bad data is actually an error and not caused by any natural phenomena.
Thank you for suggesting Normalization, I'll look into it and see if that can help with my dataset.
 

jdraw

Super Moderator
Staff member
Local time
Today, 02:49
Joined
Jan 23, 2006
Messages
15,380
I guess my concern was calculating a daily average, but selectively disregarding certain values.
It would help if you showed your table and relationship structure.
How often do you check/calibrate your gauges?

I'm attaching a pic of a water level summary with Precipitation expected.
 

Attachments

  • waterlevel.PNG
    waterlevel.PNG
    50.3 KB · Views: 167

Pat Hartman

Super Moderator
Staff member
Local time
Today, 02:49
Joined
Feb 19, 2002
Messages
43,196
1. [Date] is a poor choice as a column name since it is the name of a function that returns the current date. If you forget to encase your name in [], you will end up with the current date rather than the date in your table column.
2. NEVER format dates in queries UNLESS you are intending to export the query to Excel and you need to coerce Excel into seeing things your way. Formatting a date using the format function turns it into a string and so it loses its "date" properties and acts like a string.
 

Roger9

New member
Local time
Yesterday, 23:49
Joined
Aug 7, 2019
Messages
7
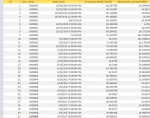
@jdraw: I have attached few examples of what my data looks like,
Data_logger table: This table has all the hourly data including columns for site_serial (unique for each gage), date-time, uncompensated water levels (in the original code referred to as ch1_data_P), barometric pressure (in the original code referred to as ch2_data_P), temperature, and other not so very important data.
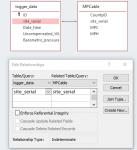
MPCable_table: information of cable length MPC (for each site_serial), MPH height to the suspended sensors required for calculating water levels at each gage
Relationship table: I have simply dragged and joined the site serial from logger table to MPCable.
Final_table: that's how I have setup the final table to look like for daily data.
Sort_Finaltable: can see the duplicate records

The logger table gets updated with new hourly data almost daily or maybe in 2 days and I have created the query so that whenever I want, I can run it to get the most recent data updated in the final table.
About the calibration: I am not quite sure how often these systems get checked, but my guess will be "not frequently".

As you can see the final table has daily data for all the gages. If I want to look at the most recent data for a specific gage, I simply use the sort options. That's when I figured out that there's duplicate rows for all the gages for all days. I wonder what's causing that? Again it's not a big problem but it'll be nice if I can fix it.
 

Attachments

  • MPCable_snip.PNG
    MPCable_snip.PNG
    10.6 KB · Views: 175
  • logger_table_snip.PNG
    logger_table_snip.PNG
    50.5 KB · Views: 172
  • Table_relationship.PNG
    Table_relationship.PNG
    14.4 KB · Views: 160
  • Final_table.PNG
    Final_table.PNG
    17.6 KB · Views: 169
  • Sort_Finaltable.PNG
    Sort_Finaltable.PNG
    16.9 KB · Views: 167
Last edited:

jdraw

Super Moderator
Staff member
Local time
Today, 02:49
Joined
Jan 23, 2006
Messages
15,380
What is your role with respect to this database/application?

There are some issues with your set up. Pat Hartman has identified some key points in #5.
Every table in the database should have a Primary Key. You should enforce referential integrity on relationships to take advantage of inherent database actions. Normalization is a basic concept to relational database.

If you are going to use this as a learning exercise, then DO NOT WORK with an operational database. Make a copy of the database and separate it from your operational system. Always work with a copy.
Also, if you do not have a backup scheme in place, research and establish a backup method.

Start with some tutorials to learn concepts of relational database. Youtube has a number of these and Google can help you find most anything you need. It can be your friend when you encounter terms you do not understand.
Good luck with your project.
 

Roger9

New member
Local time
Yesterday, 23:49
Joined
Aug 7, 2019
Messages
7
I am just trying to learn to use queries for data management and yes I'm definitely working on a copy. The actual database is safe from my edits! Thanks to you and Pat Hartman for suggestions and key points! I'll look into that and try to make changes accordingly!
 

Users who are viewing this thread

Top Bottom