First of all, apologies if I am posting in the wrong section. I am not sure if this is a report, VB or query question.
I have a database that track projects. Each quarter I have to generate a bar chart showing total number of projects at each stage (there are 5 stages). Then I have to break down these totals for the 3 different departments/groups. I can accomplish this, but if a series is null the colours don't stay the same.
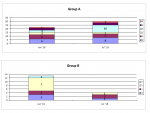
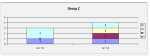
If you look at the attached picture(capture.png) you will see what I mean. In the top chart stage two is yellow and because there is no stage 2 data in the bottom chart stage 3 becomes yellow.
I have had some success with TRANSFORM CLng(Nz(Count(*),0)) AS [Count] forcing 0 to be shown for null values, but my issue with this is I have to show the series value in the data label of the chart. So 0 appears in the middle of the two series see capture2.png. Anyone have any ideas on how to force the colours to stay the same?
Thank in advance,
Poco
I have a database that track projects. Each quarter I have to generate a bar chart showing total number of projects at each stage (there are 5 stages). Then I have to break down these totals for the 3 different departments/groups. I can accomplish this, but if a series is null the colours don't stay the same.
If you look at the attached picture(capture.png) you will see what I mean. In the top chart stage two is yellow and because there is no stage 2 data in the bottom chart stage 3 becomes yellow.
I have had some success with TRANSFORM CLng(Nz(Count(*),0)) AS [Count] forcing 0 to be shown for null values, but my issue with this is I have to show the series value in the data label of the chart. So 0 appears in the middle of the two series see capture2.png. Anyone have any ideas on how to force the colours to stay the same?
Thank in advance,
Poco
Attachments
-
 Capture.PNG12.4 KB · Views: 102
 -
 Capture2.PNG5.5 KB · Views: 104
Last edited:
")