Graph Data Label Format (1 Viewer)

xyba

Registered User.
Local time
Today, 13:58
Joined
Jan 28, 2016
Messages
189
Maybe I'm looking too hard but I can't find a way of changing the format of the data labels in a graph. They default to black but I have a dark background so want to change that.

Does anyone know how to change this value, please?
 

arnelgp

..forever waiting... waiting for jellybean!
Local time
Today, 20:58
Joined
May 7, 2009
Messages
19,230
on design view of your form, double click the graph.
double click the labels to see its property.
 

isladogs

MVP / VIP
Local time
Today, 13:58
Joined
Jan 14, 2017
Messages
18,211
Are you using the 'modern' charts available with Access 365/2019 or the traditional charts available in both earlier versions and current version?
 

xyba

Registered User.
Local time
Today, 13:58
Joined
Jan 28, 2016
Messages
189
Are you using the 'modern' charts available with Access 365/2019 or the traditional charts available in both earlier versions and current version?

I'm not too sure. How would I check?
 

isladogs

MVP / VIP
Local time
Today, 13:58
Joined
Jan 14, 2017
Messages
18,211
If you are running anything up to and including A2016 retail, it will be a traditional chart.
A2019 retail or 365 has both and it depends which button was used to create the chart:


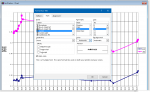
If its a traditional chart, Arnel's explanation is what you need:


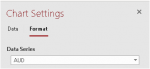
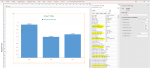
However that doesn't work for modern charts which are easier to create but you have less control over the appearance. Go to the Format tab in the Chart Settings and see if you can find anything there


I don't use them as I find them less useful for my needs so am not an expert on these . However in A365 you can search the Help menu for this item 'Create a chart on a form or report'. Hopefully that will give you the answer you need. If so, please post back for the benefit of others
 

Attachments

  • TwoChartTypes.PNG
    TwoChartTypes.PNG
    20.2 KB · Views: 1,639
  • TraditionalChartDesign.PNG
    TraditionalChartDesign.PNG
    32.7 KB · Views: 1,901
  • ModernChartSettings.PNG
    ModernChartSettings.PNG
    1.7 KB · Views: 1,592

arnelgp

..forever waiting... waiting for jellybean!
Local time
Today, 20:58
Joined
May 7, 2009
Messages
19,230
I have 2019 (cracked not retail) but I don't have that.
what is the Class name?

mine is MSGraph.Chart.8
 

isladogs

MVP / VIP
Local time
Today, 13:58
Joined
Jan 14, 2017
Messages
18,211

The_Doc_Man

Immoderate Moderator
Staff member
Local time
Today, 07:58
Joined
Feb 28, 2001
Messages
27,156
Are we talking manual adjustment of color or using VBA?
 

arnelgp

..forever waiting... waiting for jellybean!
Local time
Today, 20:58
Joined
May 7, 2009
Messages
19,230
after much googling, finally found it (I hope):
on the Load event of your form, change the color of the data labels.
on VBA you may wish to select a ColorIndex or Color, press F2 and search ColorIndex.
change vbRed to whatever color you want.
change the graph name to your graph name.
the commented line also works if you want ColorIndex.
Code:
Private Sub Form_Load()
Dim s As Variant
For Each s In Me.Graph0.Object.Application.Chart.SeriesCollection
   With s
     '.DataLabels.Font.ColorIndex = 15
     .DataLabels.Font.Color = vbRed
   End With
Next

End Sub
 

isladogs

MVP / VIP
Local time
Today, 13:58
Joined
Jan 14, 2017
Messages
18,211
Hi
I haven't tested the code Arnel posted as I only saw his reply after checking out the modern chart property sheet in A365

Unlike the old or traditional' charts, you cannot click on items in a modern chart.
Instead you edit it using the Chart Settings tab and/or the Chart Property sheet

This includes several colour properties you can alter:


I couldn't find any method for changing the colour of the chart values.
Although you can change the label fontname & size, I couldn't see how to change the font style (bold/italic etc)

Hope that helps
 

Attachments

  • FormattingModernChart.PNG
    FormattingModernChart.PNG
    57.4 KB · Views: 1,480
Last edited:

Isskint

Slowly Developing
Local time
Today, 13:58
Joined
Apr 25, 2012
Messages
1,302
Happy New Year all!:)

Can anyone confirm if arnelgp's code worked? I have a similar requirement using the modern chart option, but that code does not work for me. I get Object doesnt support this property or method.
 

sonic8

AWF VIP
Local time
Today, 14:58
Joined
Oct 27, 2015
Messages
998
Can anyone confirm if arnelgp's code worked? I have a similar requirement using the modern chart option, ...
arnelgp's code is for classic charts (MsGraph.Chart ActiveX) only.

If you are using Modern Charts, rather look at what Isladogs posted.
 

isladogs

MVP / VIP
Local time
Today, 13:58
Joined
Jan 14, 2017
Messages
18,211
It didn't work for me either (same error).
I tried using intellisense to do variations on that but never found a solution.
If you haven't already done so, have a read ofr the modern charts help article: https://support.office.com/en-gb/article/create-a-chart-on-a-form-or-report-1a463106-65d0-4dbb-9d66-4ecb737ea7f7
If its not covered there, you probably can't do it - ridiculous though that may seem.

However you could go back to using a traditional chart where it is definitely possible to change both colour and position of data labels

EDIT
Forgot to say that I spent some time playing with modern charts in the post https://www.access-programmers.co.uk/forums/showpost.php?p=1656830&postcount=4
It includes some code and an example app but I failed to change the data label colour using code or the interface
 
Last edited:

Users who are viewing this thread

Top Bottom