Hi there Everyone. Please help me as this problem is driving me mad. Here is the situation:
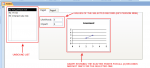
I have a form. On the form I have an unbound list. By the help of a VBA code when I choose a record on the list (in my case risks) I get the likelihood and impact numbers of that particular risk. So far everything works fine. What I want to do is to add a chart which shows the impact and likelihood on scatter graph. I would like this chart to show the graph for each different record (risk) and of course when I click on another record (risk), to show the impact and likelihood for that particular record (risk). Now all I got is that the chart shows the scatter points for every risk. What I would like is to have only one scatter point showing the values for the selected record. I am clueless, I do not know what and how to do.
You can find the attached accdb file attached to see what I mean. Please try to help. Thank you in advance! for your help!