I don't have much experience with creating pivot charts so please bear with me.
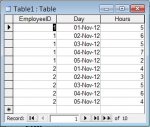
I basically have a table like this:
| EmployeeID | Day | HoursWorked |
| 1 | 1/11/12 | 5 |
| 1 | 2/11/12 | 6 |
| 1 | 3/11/12 | 5 |
| 1 | 4/11/12 | 7 |
| 1 | 5/11/12 | 2 |
| 2 | 1/11/12 | 4 |
| 2 | 2/11/12 | 3 |
| 2 | 3/11/12 | 5 |
| 2 | 4/11/12 | 6 |
| 2 | 5/11/12 | 4 |
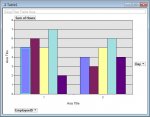
I have dropped the EmployeeID and Day into the category fields and then HoursWorked into series field but nothing shows up. Can you tell what I am doing wrong?
Thanks and apologies again for the newbie questions.
I basically have a table like this:
| EmployeeID | Day | HoursWorked |
| 1 | 1/11/12 | 5 |
| 1 | 2/11/12 | 6 |
| 1 | 3/11/12 | 5 |
| 1 | 4/11/12 | 7 |
| 1 | 5/11/12 | 2 |
| 2 | 1/11/12 | 4 |
| 2 | 2/11/12 | 3 |
| 2 | 3/11/12 | 5 |
| 2 | 4/11/12 | 6 |
| 2 | 5/11/12 | 4 |
I have dropped the EmployeeID and Day into the category fields and then HoursWorked into series field but nothing shows up. Can you tell what I am doing wrong?
Thanks and apologies again for the newbie questions.