Crosstab Query & Calculating differences (1 Viewer)

MattioMatt

Registered User.
Local time
Today, 05:40
Joined
Apr 25, 2017
Messages
99
I'm currently using a Crosstab query to be able to output statistics on a month by month basis. This is providing me with a count of statuses based on an inventory month by month.
I'm going to be uploading my data from Excel on a monthly basis. I've added a field to populate the date at which the data was uploaded on.

An example of what I'm acheiving at the moment (which is what I wanted) is the below:
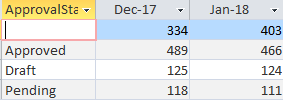


My query is as follows:
Code:
TRANSFORM Count(tbl_Inventory.ID) AS CountOfID
SELECT tbl_Inventory.ApprovalStatus
FROM tbl_Iventory
GROUP BY tbl_Iventory.ApprovalStatus
PIVOT Format([UploadDate],"mmm-yy");

I'd like to calculate the change between the months. I was looking at having a change column for each month, but quickly found I couldn't do this within the Crosstab query, simply because I've not been able to use a field for any calculations. If I try to use The UploadDate or CountOfID Access says it can't find a field with that name.
I then tried to created a new query and use the crosstab query as the source. The problem I've ran into here is that the month fields are dynamic and making the calculation is manual. Is there a way to 'automate' this?


Attachments

  • CT_Query_Example.PNG
    CT_Query_Example.PNG
    3.9 KB · Views: 1,261
  • Query_Manual_Process.PNG
    Query_Manual_Process.PNG
    1.6 KB · Views: 1,232

isladogs

MVP / VIP
Local time
Today, 05:40
Joined
Jan 14, 2017
Messages
18,221
So what will happen when you get new entries for Feb, Mar etc?
Difference columns for each pair of months?

One way of doing this is to create a make table query based on your crosstab
Then create another query to calculate the difference using that table.
 

CJ_London

Super Moderator
Staff member
Local time
Today, 05:40
Joined
Feb 19, 2013
Messages
16,612
you can make it dynamic by using by using a generic term for your month headings (e.g. 'last month', 'this month'). However your data shows 2 months but the query implies there could be many months so this may not be sufficient.

Or you could use a separate query.

You need to provide more information about how your data is structured. If only 2 months of data then you can use an alias as above or you will need to use a numerical formatted value for the month that can be sorted e.g. 201712, 201801
 

Frothingslosh

Premier Pale Stale Ale
Local time
Today, 00:40
Joined
Oct 17, 2012
Messages
3,276
It's possible, but you'll need to use a union to determine the change in counts, then turn THAT into a crosstab.

Example HERE.

There's probably a much easier workaround, however. How does this data get to the people it's for? You could either drop it into a report in Access and add a control that does that, or you could export it to Excel (either manually or via automation), then modify the cells to the right of your second data column to show the difference (which you can do en masse). Both would be pretty straightforward to implement.

And if you need help there, HERE is a guide on how to create a crosstab report.
 

Mark_

Longboard on the internet
Local time
Yesterday, 21:40
Joined
Sep 12, 2017
Messages
2,111
@OP,
Will this be for a static period or for a rolling period? Also will you be prompting for an end date? For ApprovalStatus, is this coming from a static list of statuses or are they subject to change?
 

MattioMatt

Registered User.
Local time
Today, 05:40
Joined
Apr 25, 2017
Messages
99
Thanks for the all of the replies so far

Ridders/CJ/Mark, yes, there will be more months to follow, currently it is only showing as two as thats where I've been collecting the data for. Ultimately it will grow as the dataset grows which is an upload that will occur once a month.
The ApprovalStatus is subject to change.

Frothingslosh, Are you saying use the crosstab within a union and then create a new cross tab or are you saying use a union query then create the crosstab query?
 

CJ_London

Super Moderator
Staff member
Local time
Today, 05:40
Joined
Feb 19, 2013
Messages
16,612
yes, there will be more months to follow
SO still not clear what you are asking - are you only interested in this month/last month or do you want to see a whole range of months. Either way, as the months progress you will also need to add criteria to limit the months to be viewed.
 

arnelgp

..forever waiting... waiting for jellybean!
Local time
Today, 12:40
Joined
May 7, 2009
Messages
19,243
You need to create a function then display it in a datasheet form.
 

MattioMatt

Registered User.
Local time
Today, 05:40
Joined
Apr 25, 2017
Messages
99
Apologies CJ.

I initially wanted it to be each month, this is what I'd still prefer to have. However if it's only possible with the last month in the cycle then I'm happy with that.
 

arnelgp

..forever waiting... waiting for jellybean!
Local time
Today, 12:40
Joined
May 7, 2009
Messages
19,243
Give me something to work with. Post a sample data on excel and the expected result in same excel.
 

Pat Hartman

Super Moderator
Staff member
Local time
Today, 00:40
Joined
Feb 19, 2002
Messages
43,275
As you can see by the responses, this is not a trivial task. The problem is that we are working with a moving target. Each time you run the query, the column names could change so short of VBA, there isn't a clean way to solve the problem. It is trivial for Excel because excel works with cells which always have known names. The way the crosstab works, the column names change depending on what date range you select and a query of the crosstab which is what you would need to do the calculation, cannot support varying column names.

The solution lies in the technique used to solve the problem of reporting on this type of data. The first issue is to decide on the maximum number of columns you want to view in your report. The typical answer is 12. It could be more or less but will have to be fixed and you also need to keep in mind Access' formatting limitations. One of my applications uses it to show data for 20 years so it uses 20 columns. You have only 22 horizontal inches in a report and that includes the margins.

I've attached a database that I call "Bound Denormalized Forms". I came up with the concept when I was building a budgeting application for a client and he really wanted to enter the data on a form that showed 12 calendar months. Of course, denormalizing the underlying tables would have led to lots of other issues but I figured out a way to create a bound form that looked like a spreadsheet. The zip file contains the PP presentation I built when I presented the database to my Access group.

The database contains two sets of example data so you can see the logic is transferable. One is the typical forecast problem of 12 months and the other is a more variable problem dealing with expenses for an income property. I only built the report for the Expense example but the technique will be identical for the Forecast example.

Please respect the notice on the About form. Use the code however you wish in your own applications but if you share the database with anyone else, be sure to share the unmodified version.

The process behind the report converts the variable columns to fixed columns numbered 1 to n depending on how many you want. Knowing the exact column names and their relationships will allow you to create calculations either in the query or in a report.

PS - you'll see the problem with naming the columns mmm-yy next month when Feb comes between Dec and Jan. To make the columns sort correctly, they need to be yy-mm. Or if your query will be fixed, Jan-Dec, you could use column headings to get them in month order. The problem when you have a rolling range is that you need year as part of the label and that means you can't use just month name and you can't use column headings at all unless you want to rebuild the query on the fly.
 

Attachments

  • BoundDenormalizedFormWithNewForm.zip
    1.9 MB · Views: 113
Last edited:

Mark_

Longboard on the internet
Local time
Yesterday, 21:40
Joined
Sep 12, 2017
Messages
2,111
@OP

When you are done, how many months will this cover? Please don't say "All of them" as that means you are asking for a perpetual count that would need to be done in a report, not a query. In most businesses they are only interested in what the changes were over the last year, often a rolling year. If you are not sure, please clarify your specifications. Otherwise you will be asked what the difference was between February 713 and March 713, then have to clarify if they want "The one before Rome became an empire or the one after Rome collapsed?"

For ApprovalStatus, is this coming from a static list of statuses or are they subject to change? I am guessing this won't change unless you will be reworking your database. Once more, please find out. It will help us answer how you can do what you are looking for. Likewise this is something that should be in specification.
 

MattioMatt

Registered User.
Local time
Today, 05:40
Joined
Apr 25, 2017
Messages
99
Give me something to work with. Post a sample data on excel and the expected result in same excel.

Thanks for your reply - I've attached limited sample data.
 

Attachments

  • SampleData.xlsx
    13.1 KB · Views: 68

MattioMatt

Registered User.
Local time
Today, 05:40
Joined
Apr 25, 2017
Messages
99
Pat, thank you so much for your detailed look at this and thank you for the attachment. I will of course have a look through this. I've particularly taken onboard the notes about the dates and how to format them.
 

MattioMatt

Registered User.
Local time
Today, 05:40
Joined
Apr 25, 2017
Messages
99
@OP

When you are done, how many months will this cover? Please don't say "All of them" as that means you are asking for a perpetual count that would need to be done in a report, not a query. In most businesses they are only interested in what the changes were over the last year, often a rolling year. If you are not sure, please clarify your specifications. Otherwise you will be asked what the difference was between February 713 and March 713, then have to clarify if they want "The one before Rome became an empire or the one after Rome collapsed?"

For ApprovalStatus, is this coming from a static list of statuses or are they subject to change? I am guessing this won't change unless you will be reworking your database. Once more, please find out. It will help us answer how you can do what you are looking for. Likewise this is something that should be in specification.

Hi Mark - thanks for you reply.
This is to be a 12 month rolling period.

The statuses do not currently from another table in which and ID is used - obviously that would be the right way to do it, but due to the data being premature and working through issues I'm currently basing my queries on imported data from excel.
At the moment the statuses are static but I cannot say for sure if they will/will not change in the future.
 

Pat Hartman

Super Moderator
Staff member
Local time
Today, 00:40
Joined
Feb 19, 2002
Messages
43,275
You're welcome. Play around with the example. The forecast is a fixed 1 year period. But you can make it rolling by using the technique that the expense report uses.
 

Users who are viewing this thread

Top Bottom