Solved Aesthetic boxes on a report

donkey9972

Registered User.
Local time
Today, 13:30
Joined
May 18, 2008
Messages
145
Hi, I know this is probably not advisable, but I was wondering if it is possible to make blank boxes on a report, and as each entry gets filled in it takes up one line of the report. So I have a report that is due monthly, it has 17 entries in columns, and 31 days labelled on the left side. I know one piece of advise will be to simply use excel, but all the data is input into access, and the reports are emailed out, there is about 20 reports. all of them are coming from access except this one. The people receiving them do not want to have to deal with multiple attachments and asked me to try to find some solution, they want things nice and tidy all in one attachment. So is this possible? I have tried to put blank boxes on the report but all that happens is as the data is populated it pushes those boxes down on the report and setting the data on top of it. Anyway, here is to hoping.
 
I am unsure as to how these things should align.

I was wondering if it is possible to make blank boxes on a report, and as each entry gets filled in it takes up one line of the report.

OK, so an entry gets filled and it takes up one line of the report. What happens for entries that aren't filled for some reason, and what do these check boxes have to do with anything? Since what you want isn't that clear, I'm not going to say you can or cannot do it. But I know I can't do it because I don't understand it.
 
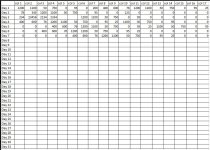
Ok, I will try to explain it a bit better. You know on excel you can format the boxes to fit into one page and be displayed as squares all across the page if there is data or not? Something like that but done on access without the use of excel so I can try to get this report inline with all the others that there are. I have attached a picture of an excel spreadsheet as an example.
 

Attachments

  • Capture.JPG
    Capture.JPG
    136.3 KB · Views: 19
Thank you for the link. I am working on another part right now, I was just trying to get the information available to me before I got stuck there. Once I am at that point I will delve more into it. I will mark this as solved for now, it looks like what I am wanting. Again thank you.
 
I would do it with a dummy table. It would have fields

DayLabel
col1
...
col17

In the daylabel field create records with values (Day 1, Day 2)
So this table would look like your image without anything in columns.
1. Create an update query "qryClearColumns" that sets all columns to null. Do this before running the report.
2. You will have to show us how your data is stored. Hopefully it is in a more normalized format. Then you run a query to get the records you want for the report and read the records. You then put the correct values into the table by code. If the data is not normalized then it can be done with an insert query.

If you make this dummy table and give us a sample of real data the code is pretty easy to show you.
 
It would seem to me that you could employ the .CanGrow and .CanShrink properties (both set to NO) to lock down control sizing on your report.
 
I would use a table of numbers [tblNums] with values from 0 to 30 (or much higher). Then assuming you have a form [frmDateSelect] with a text box [txtStartDate] create a query [qselDates] with this SQL:

Code:
SELECT  DateAdd("d",[Num],[Forms]![frmDateSelect].[txtStartDate]) AS AllDates
FROM tblNums
WHERE Num<=30;

Then, add this query to your report's record source with a join that includes all records from [qselDates].
 

Users who are viewing this thread

Back
Top Bottom