Finding the 10 most common entries in a given column

Bean Machine

Member
Local time
Today, 06:46
Joined
Feb 6, 2020
Messages
102
Hi all,

I am struggling a bit to come up with a solution here. I would like to have a column that just lists the top 10 most frequent text entries from another column. Ideally I would like to do this as a formula as macros are not supported on the online excel version. I have tried the =INDEX(MATCH(#:#,#:#,0))) function but to no avail.

The data I would like excel to sift through is located on the "Data Master Sheet" in range "O:O", and I would like the values to paste to "A2:A12" in sheet "Data Filtering". Hopefully this makes sense, let me know if more information is needed.
 
I note that you have yet to receive and reply. I'm posting this message to bump your message up to the top of the list so that it gets viewed again...
 
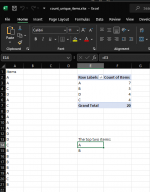
Using what I read in an article titled "Count Unique and Distinct Values in Excel [With Examples]" I created a pivot table with the count of distinct items in my list. Then sorted that by count in descending order. Now just make another area where you link to the first 10 cells of this pivot table. Here in this workbook, I entered 20 items (A, B, C, D) the pivot tables show each unique item and the count of how many times they are in the list. Below it I am showing the top two, which are just simple links to the top two rows of the pivot table.

Use Alt-F5 to update the pivot table when your source data changes. I hope this gets you closer to your goal.

I can't upload or post a link to the file I created; it keeps marking my post as spam. Same with the link to the article I read.
 

Attachments

  • Screenshot 2024-03-22 093630.png
    Screenshot 2024-03-22 093630.png
    29.5 KB · Views: 86
If Power Query is supported then this is pretty easy.
Code:
let
    Source = Excel.CurrentWorkbook(){[Name="Table1"]}[Content],
    #"Changed Type" = Table.TransformColumnTypes(Source,{{"Column1", Int64.Type}}),
    #"Grouped Rows" = Table.Group(#"Changed Type", {"Column1"}, {{"CountValues", each Table.RowCount(_), Int64.Type}}),
    #"Sorted Rows" = Table.Sort(#"Grouped Rows",{{"CountValues", Order.Descending}}),
    #"Kept First Rows" = Table.FirstN(#"Sorted Rows",10)
in
    #"Kept First Rows"

Pick data
Do a group by
Sort the group by column
pick Keep Rows and type N
 
Using what I read in an article titled "Count Unique and Distinct Values in Excel [With Examples]" I created a pivot table with the count of distinct items in my list. Then sorted that by count in descending order. Now just make another area where you link to the first 10 cells of this pivot table. Here in this workbook, I entered 20 items (A, B, C, D) the pivot tables show each unique item and the count of how many times they are in the list. Below it I am showing the top two, which are just simple links to the top two rows of the pivot table.

Use Alt-F5 to update the pivot table when your source data changes. I hope this gets you closer to your goal.

I can't upload or post a link to the file I created; it keeps marking my post as spam. Same with the link to the article I read.
You can break up the link so that it is not recognised as such.
This limitation is to deter spammers.
Once you have a few posts under your belt, you will be able to post links normally.
 

Users who are viewing this thread

Back
Top Bottom