Hi,
I've recently decided to revamp my company's method of tracking current projects.
The current methods is an excel based spreadsheet that has tabs for employees, holidays, training, (about 90 tabs of calculations) and one final sheet that brings it all together to show what projects people are on, when they are on holiday on those jobs and when these jobs are, an example of what this looks like is attached:
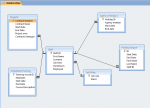
I've so far created a database with all the relevant information, however i'm completely confused now as how to or even if it is possible to collate all this data into a format like the screenshot, similar to a gantt chart. I've also attached a screenshot of my relationships to show how I've got everything connected.
Mostly the way that each of the tables are connected are via query's and drop down boxes in case that helps.
Good luck to anyone who can help me out with this, and thank you
Attachments
Last edited:


