AlyKatVandy
New member
- Local time
- Today, 12:02
- Joined
- Jul 5, 2019
- Messages
- 2
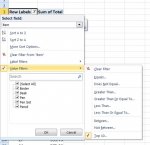
Greetings! I work in a call center and am responsible for reporting on certain phone data. I have a separate pivot table with each agent, how many times they went into a specific phone state and how long they were in that state. I am trying to create a second table next to the first with the top 10 agents for the count of that state and the top 10 agents for the duration of being in that state. I am having trouble figuring out how to narrow the data down to the top 10. Any tips?