Hi there
I have a problem with the chart/graph object. It's embedded on a form, and the data within can change quite a bit in scope and scale (date ranges could be 1 minute to 1 year, values might be 0-10 or 0-10000 or more.
So I nee the axis to scale automatically. I set a row source to dynamically change that it's looking at. It's being very temperamental.
Example:
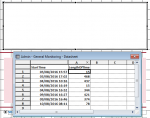
My chart object. Showing nothing! Note there is a set of data. Form design mode.

Same chart object, form in normal mode.

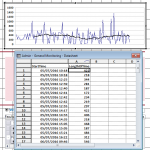
After set various row sources, it might eventually show something. Note that the rowsource to get this showing was selected several times in setting various row sources - identical each time. No apparent reason it would start showing something on any particular attempt!

So back into design mode on the form... hold on a minute, its formatted properly and I can see everything..... what??

I suspect something (y-axis) is not being recalculated or refreshed or re-something when the rowsource is updated.
Note the Y axis is all set to auto....

Any ideas?
Have tried to force things from code, but you know what the chart object is like - even finding the right method can be a nightmare to try there. Didn't manage it.
Any ideas? I'm stuck
Happens on all chart object's i've tried this on (data varies a lot on all of them) + recreating them doesn't help.
All data is ordered btw, and is a simple <date>, <number> list - nothing complex.
Many thanks
Martin
I have a problem with the chart/graph object. It's embedded on a form, and the data within can change quite a bit in scope and scale (date ranges could be 1 minute to 1 year, values might be 0-10 or 0-10000 or more.
So I nee the axis to scale automatically. I set a row source to dynamically change that it's looking at. It's being very temperamental.
Example:
My chart object. Showing nothing! Note there is a set of data. Form design mode.

Same chart object, form in normal mode.

After set various row sources, it might eventually show something. Note that the rowsource to get this showing was selected several times in setting various row sources - identical each time. No apparent reason it would start showing something on any particular attempt!

So back into design mode on the form... hold on a minute, its formatted properly and I can see everything..... what??

I suspect something (y-axis) is not being recalculated or refreshed or re-something when the rowsource is updated.
Note the Y axis is all set to auto....

Any ideas?
Have tried to force things from code, but you know what the chart object is like - even finding the right method can be a nightmare to try there. Didn't manage it.
Any ideas? I'm stuck
Happens on all chart object's i've tried this on (data varies a lot on all of them) + recreating them doesn't help.
All data is ordered btw, and is a simple <date>, <number> list - nothing complex.
Many thanks
Martin
