Solved Help adjusting chart's min/max Y-Axis value using code

iCyrius

New member
Local time
Today, 02:30
Joined
Apr 5, 2016
Messages
18
Hello,

In Excel it is possible to adjust the min/max Y-axis values using code. Can this be done in Access?

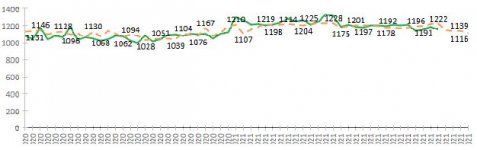
I have included an example where due to the Y-values starting from 0, it is hard to appreciate the differences. I can manually adjust the minimum, but this is a chart template that gets regenerated with new data that can fall below the manually set value. I will look at the fresh data's minimum and adjust Y axis with that value.

Please be clear I am not soliciting the whole code to do this, just the line to adjust the chart's Y-axis minimum value.

Thank you for your help!!!
 

Attachments

  • Chart adjust.JPG
    Chart adjust.JPG
    27.9 KB · Views: 472
In Powerpoint you use the charts axes properties, it will be the same in excel.

.Chart.Axes(xlCategory).MinimumScale = YourIntegerValue
 
In Powerpoint you use the charts axes properties, it will be the same in excel.

.Chart.Axes(xlCategory).MinimumScale = YourIntegerValue
Thanks for your reply. What would be the line code in Access?

I am looking at the Chart and ChartAxis classes and do not see where to do it.

THanks
 
this example uses Modern chart.
see the Load Event of Form1.
 

Attachments

Thanks for your reply. What would be the line code in Access?

I am looking at the Chart and ChartAxis classes and do not see where to do it.

THanks

The lines I posted are actually from Access in a PowerPoint automation script.
So they should be exactly as typed.
 
this example uses Modern chart.
see the Load Event of Form1.

I finally got to test the code today and received an error.

I get a "Method or data member not found" in line
With Me.Chart8 <-----That is my chart's name

I will keep testing it over the weekend. Thanks for your help.
 
so, it is the Old chart and not the Modern chart.
see this demo.
 

Attachments

so, it is the Old chart and not the Modern chart.
see this demo.

Sorry to bother you again but it seems I need to add a library for the code to work.

I get a Automarion error, Library not registered and the line is
.ApplyDatalabels 2

And if I comment that line then the error moves to the next one
With .Axes (2)

Thanks
 
in design view of your form, click on the Chart
what does it's "Class" show in the Property Sheet->Data?
 
arnelgp example works for me. No library needs to be added. Only the standard 4 libraries set for a new db are selected.
Perhaps you should provide your db for analysis.
 
I will also prepare an access file to upload here. Thanks
 
So, I built this sample file at work where they use Office 365 and the code worked. However, when I open the same file at home using Office 2016 it does not work.

In office 2016 I get an error saying: a problem occurred while Mocrosoft Access was communicating with the OLE server or ActiveX Control.

I guess there is no backward compatibility.
 

Attachments

There is no chart object on the form. If it is Modern Chart, it will not be available in Access 2010
 
Last edited:
it is Modern chart alright, i just Moved your code to the Load event of the form.
 

Attachments

occurred while Mocrosoft Access was communicating with the OLE server or ActiveX Contro
do not Modify a db created on English office with another office (foreign language).
 
Thank you for your help. I just have one more request. In my first sample the code will work if it reads from a table. What if the modern chart works from a query? I missed to include that detail in my first sample file. My database fills the charts using a query instead of a table for space reasons. I have included a second sample where the Dmin and Dmax connects to the query name. Apparently it would not that way. Would I have to create a table to make this code work?

Thanks!!!!!!
 

Attachments

i moved the code Again to the Load event of the form.
also change the Quantity to Quantity2 in the code.
 

Attachments

Users who are viewing this thread

Back
Top Bottom