RussellDeano
Registered User.
- Local time
- Today, 07:02
- Joined
- Aug 19, 2017
- Messages
- 22
Hello All,
I am trying to manipulate a chart based on a selection of combo boxes and a between dates picker but being new to access and not being competent with VBA and SQL i am struggling somewhat.
I have a table of information called "Events"
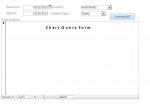
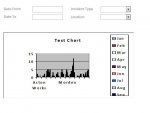
And from that information i would like to have the ability to display a chart on a form or subform that displays the incidents based on the user selecting criteria
Date from
Date to
Incident Type
Incident Location
For example if the end user select
01/01/2017
to
10/02/2017
Accidents
Northfields
I would like the chart to show all "Accidents" that happened at Northfields between 01/01/2017 and 10/02/2017.
I have searched online but cannot find a simple explanation or tutorial of how to do this. Unfortunately those i have found have been too advanced for me to follow.
Any help would be appreciated. I have attached an image of the rough final look i was thinking about for the form.
I am trying to manipulate a chart based on a selection of combo boxes and a between dates picker but being new to access and not being competent with VBA and SQL i am struggling somewhat.
I have a table of information called "Events"
And from that information i would like to have the ability to display a chart on a form or subform that displays the incidents based on the user selecting criteria
Date from
Date to
Incident Type
Incident Location
For example if the end user select
01/01/2017
to
10/02/2017
Accidents
Northfields
I would like the chart to show all "Accidents" that happened at Northfields between 01/01/2017 and 10/02/2017.
I have searched online but cannot find a simple explanation or tutorial of how to do this. Unfortunately those i have found have been too advanced for me to follow.
Any help would be appreciated. I have attached an image of the rough final look i was thinking about for the form.
Attachments
-
 Capture.JPG30 KB · Views: 96