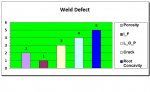
Good Morning Developers, I already create a query that consist of slag_inclusion, poros, i.f, l.o.p, crack, root_concavity. based on this query, I create a chart.
But the problem is, the chart only showing 5 bar (that consist of poros, i.f, l.o.p, crack, root_concavity), but where is bar for slag_inclusion ??? please see pic004 on attachment.
What i want to ask is, how to create a chart with 6 bar inside ??
Any help or idea would be appreciated.
Environment: Ms.Access 2010
But the problem is, the chart only showing 5 bar (that consist of poros, i.f, l.o.p, crack, root_concavity), but where is bar for slag_inclusion
??? please see pic004 on attachment. What i want to ask is, how to create a chart with 6 bar inside ??
Any help or idea would be appreciated.
Environment: Ms.Access 2010
Attachments
-
 pic004.jpg54.3 KB · Views: 65