Running Graphs in Access (1 Viewer)

StuartG

Registered User.
Local time
Today, 07:48
Joined
Sep 12, 2018
Messages
125
Hi all..

I have been tasked to provide KPI information in the database I have created and need to ask a question around date fields..

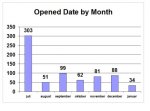
The particular field I am attempting to report on is a date field however when I run a query on this in the graph it puts the reporting in a date format, I just need it to count how many in that field

Is it possible to achieve this somehow?
The field has to remain as a date/time field..

Regards
Stuart


Sent from my iPhone using Tapatalk
 

theDBguy

I’m here to help
Staff member
Local time
Yesterday, 23:48
Joined
Oct 29, 2018
Messages
21,474
Hi. If you want to "count," then perhaps you could try using an aggregate function, like Count(), to do it.
 

StuartG

Registered User.
Local time
Today, 07:48
Joined
Sep 12, 2018
Messages
125
Hi. If you want to "count," then perhaps you could try using an aggregate function, like Count(), to do it.


So you build this into the query using VBA or can I use it in “design” criteria view?


Sent from my iPhone using Tapatalk
 

theDBguy

I’m here to help
Staff member
Local time
Yesterday, 23:48
Joined
Oct 29, 2018
Messages
21,474
Hi. It depends. We're not sure yet what you're actually doing. You could try designing a Totals query, if everything you need for the chart can be "totaled" or "aggregated" (like Sum, Count, etc.).
 

JHB

Have been here a while
Local time
Today, 08:48
Joined
Jun 17, 2012
Messages
7,732
Could you show some raw data and how you want the graph, (in Excel or a printscreen)?
 

StuartG

Registered User.
Local time
Today, 07:48
Joined
Sep 12, 2018
Messages
125
Could you show some raw data and how you want the graph, (in Excel or a printscreen)?

Please find attached.
This is the primary data that I will be running graphs from, in addition to this I will be using Queries and criterias to break down the information so its not so convoluted.

I am really keen to try and create a graph that provides a form of count on the OTF information as this is a KPI my managers are really keen to overview, however this has proven difficult because the fields are in Date/Time format which transfers to the graph and makes it messy.

Would you also agree that it would be better to create queries and then run the graphs from the queries, instead of directly from the table as I know Access supports both possibilities.

The graph in a bar chart would be better.

As always, thanks for the assistance :D:D
 

Attachments

  • Sales Data.xlsx
    100.4 KB · Views: 81

JHB

Have been here a while
Local time
Today, 08:48
Joined
Jun 17, 2012
Messages
7,732
Thanks for the raw data, but I still need to see how you want the graph.
 

StuartG

Registered User.
Local time
Today, 07:48
Joined
Sep 12, 2018
Messages
125
Thanks for the raw data, but I still need to see how you want the graph.

Apologies, guess it helps.
I have provided a form of Demo in the new tab.

This is ideally how i would like my graphs to appear in access. :)
 

Attachments

  • Sales Data.xlsx
    160.8 KB · Views: 83

isladogs

MVP / VIP
Local time
Today, 07:48
Joined
Jan 14, 2017
Messages
18,235
See attached.
I've done a 2-D version of the chart using a query on your original data
3-D can be more difficult to work with in Access
 

Attachments

  • StuartGChart.zip
    92 KB · Views: 101

StuartG

Registered User.
Local time
Today, 07:48
Joined
Sep 12, 2018
Messages
125
See attached.
I've done a 2-D version of the chart using a query on your original data
3-D can be more difficult to work with in Access

Hi Isla,

Thank you for doing this, it provides me a guide of how to build subsequent graphs..

On a side note, does the report automatically refresh itself upon opening or will i need to build a requery?

Stuart:D
 

StuartG

Registered User.
Local time
Today, 07:48
Joined
Sep 12, 2018
Messages
125
Hi Isla,

Thank you for doing this, it provides me a guide of how to build subsequent graphs..

On a side note, does the report automatically refresh itself upon opening or will i need to build a requery?

Stuart:D

Hi All,

I am at my wits end and cannot seem to get what I need achieved. I have managed to do most of them but struggling with the below:

I need to report on the following but it always returns empty:

MK Denial Completed?
Within 4 Days
Booked Orders by Month.. So shows Jan,Feb etc.

and lastly which i have been scratching my head all day.
I need to report on the OTF sent to fields, it needs to show what is currently still outstanding. but not report if it is completed.. its hard to explain its like a visual representation of exactly what we have outstanding.

I attach my DB example.

Pleeasee help :banghead::banghead::banghead:
 

Attachments

  • Stuart Graphs.zip
    340.3 KB · Views: 81

StuartG

Registered User.
Local time
Today, 07:48
Joined
Sep 12, 2018
Messages
125
Hi All,

I am at my wits end and cannot seem to get what I need achieved. I have managed to do most of them but struggling with the below:

I need to report on the following but it always returns empty:

MK Denial Completed?
Within 4 Days
Booked Orders by Month.. So shows Jan,Feb etc.

and lastly which i have been scratching my head all day.
I need to report on the OTF sent to fields, it needs to show what is currently still outstanding. but not report if it is completed.. its hard to explain its like a visual representation of exactly what we have outstanding.

I attach my DB example.

Pleeasee help :banghead::banghead::banghead:

Hi all,
Wondering if there was any guidance on the below on how I can achieve whats needed..
 

JHB

Have been here a while
Local time
Today, 08:48
Joined
Jun 17, 2012
Messages
7,732
The problem I/(we) have at the moment is to find out what data you want to output, what field(s) is/are involved and what criteria the are.
The way you showed it in post #8, was perfect, if you could do the same for the other then .... :)
 

StuartG

Registered User.
Local time
Today, 07:48
Joined
Sep 12, 2018
Messages
125
The problem I/(we) have at the moment is to find out what data you want to output, what field(s) is/are involved and what criteria the are.
The way you showed it in post #8, was perfect, if you could do the same for the other then .... :)

Hi JHB, sorry.
Please find attached.

The second graph is a picture, but provides a view of what I am after.
Graphs are in Sheet 1
 

Attachments

  • Sales Data.xlsx
    408.6 KB · Views: 88

StuartG

Registered User.
Local time
Today, 07:48
Joined
Sep 12, 2018
Messages
125
Hi JHB, sorry.
Please find attached.

The second graph is a picture, but provides a view of what I am after.
Graphs are in Sheet 1

I all so after much persistent on myself, i think I have manged to achieve what I wanted however my manager is not happy with something.

I have attached a photo for reference.

basically the graph reports on a yes/no, if its yes then it graphs it, the issue is it shows -1, is there anyway I can blank this out or not show it?
 

Attachments

  • Graphs - Access.JPG
    Graphs - Access.JPG
    70.3 KB · Views: 86

isladogs

MVP / VIP
Local time
Today, 07:48
Joined
Jan 14, 2017
Messages
18,235
Try setting the field to show Yes/No in the table design instead of True/false and see if that fixes it.
If not change the sql used for the chart to use an iif or switch statement converting -1 to Yes

OR just change the font on the x axis to white
 

JHB

Have been here a while
Local time
Today, 08:48
Joined
Jun 17, 2012
Messages
7,732
Is the below what you want?
 

Attachments

  • Opened date.jpg
    Opened date.jpg
    27.2 KB · Views: 236
  • Stuart Graphs.zip
    229.9 KB · Views: 89

StuartG

Registered User.
Local time
Today, 07:48
Joined
Sep 12, 2018
Messages
125
This was exactly what they required..
thanks for this..
.


Sent from my iPhone using Tapatalk

Hi JHB,

Thank you for providing the guidance on how I can get the graph to show month view, its exactly how i envisioned my dashboard to look.

There a just a couple of things I wanted to ask you.

1. How do i get it to show orders that are in this current year, so 2019 but by month view instead, as I notice the query appears to be be picking up orders that were not in 2019. :D

2. I noticed you built a table, and then completed a count of what was in the DB and then run the graph from that, how would that work in my current DB as the fields are in the "Sales Data" Tbl.

3. The names in the Graph also appear to be in a different language format, is this easily changed within my DB? :confused:

4. Im assuming that i could add the "Product Line" to my criteria, and then use the opened date as a way of breaking the data down so it only shows orders for 2019 in a month view?

Thanks again for the tips :)
 

StuartG

Registered User.
Local time
Today, 07:48
Joined
Sep 12, 2018
Messages
125
(null)

Thanks June..
Is this reply related to what JHB had posted or Isla?


Sent from my iPhone using Tapatalk
 

Users who are viewing this thread

Top Bottom