[SOLVED] Line Chart (Modern) primary axis issue

Avoraightu

New member
Local time
Today, 02:22
Joined
Mar 5, 2020
Messages
28
I have been scouring the threads but nothing seems to fix my issue with the primary axis.

1678918714069.png


I have tried setting the min and max manually but the same chart is used for several product models and the range is different between models.
I have tried using vba, but setting the min and max that way causes the axis values to disappear entirely.

None of the values from the query are less than .2 or greater than .6, having the axis start at 0 is leaving the chart with huge a huge whitespace on every chart.

Is there something I have overlooked?
 
I always do those by hand, but there are several articles in the "Similar Threads" section below that seem relevant. May I suggest looking at some of those threads as a starting point?
 
Ya I don't know if it is the version of Access that we have but I read through those and even tried some of the examples. The examples work fine when run, but fail when I try to replicate them in our live version.
 
The only advice I can give is two-fold. Set a breakpoint in your code on the instruction that will load the first of the two values you are loading, either the min or max. The breakpoint will stop before executing that line. Now EITHER (a) open the Immediate window and examine the contents of the axis properties using DEBUG.PRINT ... OR (b) hover the mouse over the properties to see what comes up. NOTE ALSO that if you are using variables (perhaps computed) to hold the new values, check what you are actually loading.
 
Thanks for the feedback I believe I am making some progress, I discovered that left on it's own Access seems to always start the axis range @ 0 for decimals less than 1.
When I debugged the example code I was getting 0 and 0 as the min and max values for the axis.

I ended up having to change the data type in the code in order to get the proper min and max values.

1678991300898.png


1678992283670.png
 
Last edited:
hi @Avoraightu

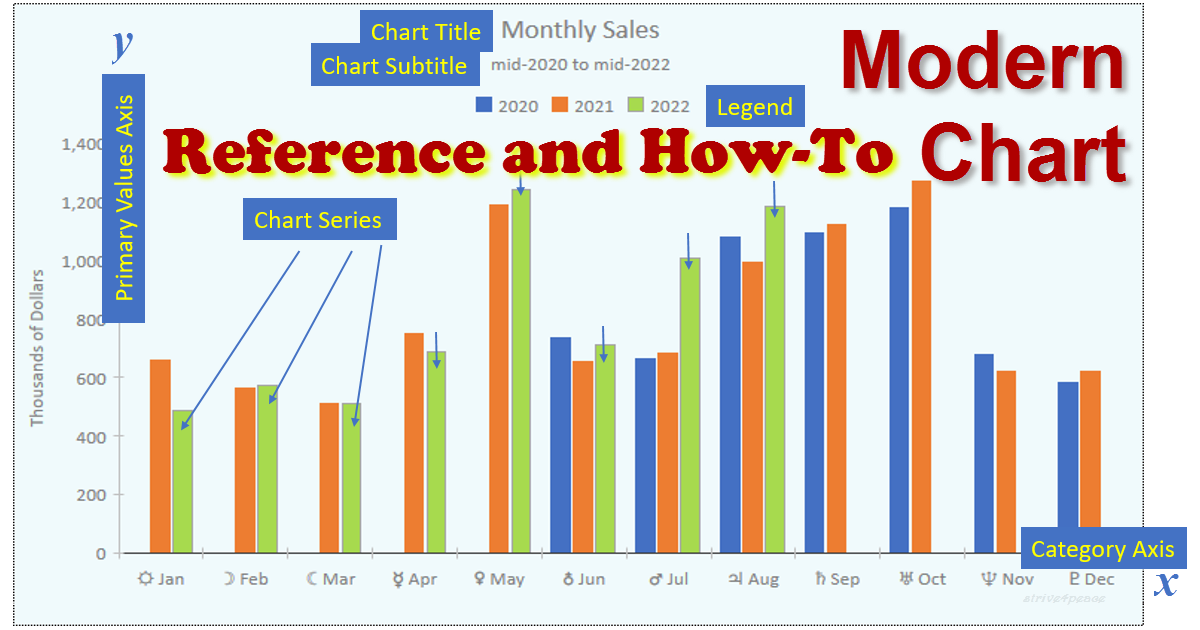
If this is a modern chart, I have a comprehensive reference here:

it seems you need to set properties. It's a long page, so here's a direct link to that spot:
https://msaccessgurus.com/article/Chart_Modern.htm#PropertiesChart

as you can see, PrimaryValuesAxisMinimum and PrimaryValuesAxisMaximum are single precision -- so no need to use variant

fwiw, I find classic charts easier to work with -- and definitely easier to change programmatically, as well as having lots more chart types. At some point I plan to make a similar reference page for them, but that will take more time since they can do much more. Out of the box, they're pretty ugly, but that's fixable.
 
Thank You

The data type single works just fine.
I think we can call this a wrap, here's what I ended up with compared to my first snip.

1678997981621.png
 
You have resolved your problem. But now that you showed us the code, I'm going to guess that originally, lngMin and lngMax were long integers? Which (after the fact) pretty much explains why you had trouble setting fractional boundaries.
 
You have resolved your problem. But now that you showed us the code, I'm going to guess that originally, lngMin and lngMax were long integers? Which (after the fact) pretty much explains why you had trouble setting fractional boundaries.
actually, they were declared as variant ... but obviously single or double wasn't what was detected ... best to declare them to be what they are. I spent lots of time figuring out correct data types for each property, where it was possible to find out!
 
Thank You

The data type single works just fine.
I think we can call this a wrap, here's what I ended up with compared to my first snip.
Glad to see you have a solution
I agree with Crystal about the severe limitations in the Modern Charts feature. It was a great first step to making charts more user friendly but its feature set is limited

When you have time I'd strongly recommend you watch Thomas Moller's video on his Better Access Charts project which uses a Javascript library to create amazing charts in Access

 
@isladogs, what Thomas has done is tremendous ... but still a candle to what Access already had with classic charts. Their big shortcoming was not better initial formatting and not being visually updated until rendering to the form view. Modern charts fixed bad look and the rendering issue ... caution: don''t UNDO till after you save! Still a nice alternative
 
Last edited:
Originally in the example code the data type was set to Long, which gave me a "0" for both the min and max, essentially making the axis disappear.
I haven't used numbers this small in a chart before so it did bring up some challenges, but as soon as I changed the data type everything started working as anticipated. (y)
 
@Avoraightu, considering @The_Doc_Man's comments, it would be good to change the variable name for lngMin and lngMax -- and the declaration statements respectively too (which I think you've already done)

1679061638711.png
 

Users who are viewing this thread

Back
Top Bottom