Dear All,
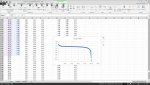
Am trying to create a graph in excel with my values. The categorization of y-axis values are done according to my views and am unable to categorize the x-axis values.
I need the x-axis categorization as 0,10,20,30,40,50,60.
I tried by viewing many articles and videos but am not enough luck to made my day. Am seeking for any positive views on my sheet.
The x-axis values are not clear in my graphs. I need it according to my categories above.
Please help me out. Am attaching my excel sheet.
Thanks