Ashfaque
Search Beautiful Girls from your town for night
- Local time
- Today, 22:32
- Joined
- Sep 6, 2004
- Messages
- 894
Hi,
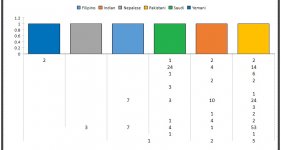
I have this cross tab query that I created using wizard and which generates figures to know how many employees employees of which nationality are in different departments. I used this cross tab query as data source to display graph on one form.
This is working and presents graph. What I am looking for is: I want to display department names also at the bottom axis of graph that will make the pic more clear.
So each department will have 5-6 numbers of columns in graph that will represent nationalities working in that dept. But even after multiple attempt I am not able to display departments in the graph. If dept. displays then we may have sum of diff nationalities to appear on column.
Can someone help me please?
Thanks,
I have this cross tab query that I created using wizard and which generates figures to know how many employees employees of which nationality are in different departments. I used this cross tab query as data source to display graph on one form.
Code:
TRANSFORM Count(T_JobOffer.CLetterDate) AS CountOfCLetterDate
SELECT T_JobOffer.CLastWorkingDate, T_JobOffer.CNationality
FROM T_JobOffer
WHERE (((T_JobOffer.CLastWorkingDate) Is Null) AND ((T_JobOffer.CNo)>0))
GROUP BY T_JobOffer.CLastWorkingDate, T_JobOffer.CNationality
PIVOT T_JobOffer.CDept;So each department will have 5-6 numbers of columns in graph that will represent nationalities working in that dept. But even after multiple attempt I am not able to display departments in the graph. If dept. displays then we may have sum of diff nationalities to appear on column.
Can someone help me please?
Thanks,


