field will not print in DETAIL section, only if moved to HEADER section (1 Viewer)

Jker

New member
Local time
Today, 02:30
Joined
Dec 8, 2023
Messages
4
in my report i have UNBOUND field that will not print when it is in the DETAIL section.. When I move it to HEADER section, it prints. I have never seen this problem before.

1702060413036.png
Notice: the #ERROR for SUPPLIER1 ... that is where i place field in DETAIL section

1702060593624.png
NOTICE: $1.11 value prints when moved to HEADER section but not when its in DETAIL

1702060744249.png
this is the report design showing the filed in HEADER section But
 

plog

Banishment Pending
Local time
Today, 01:30
Joined
May 11, 2011
Messages
11,646
We'd really need the code behind that control to help better. My guess is that it is referencing a value only available in the Header/Footer and not the Detail (like COUNT, SUM or other aggregation).

With that said and what I can see, I really question your methodology. Why so many Dlookups in a report detail section? Why didn't you use a query that brought all those values into it and use the query as the basis of your report? Additionally all those fields suffixed with numbers is a red flag. Do you actually have a field in a table called ...compare_supplier3?
 

Jker

New member
Local time
Today, 02:30
Joined
Dec 8, 2023
Messages
4
I am very new to this... and yes,, I have a PRODUCT table that has a main supplier id and his cost and 5 alternate suppliers ids and their costs.

each of those 5 alternate suppliers are in my SUPPLIER table... the reason for the DLOOKUPS at detail level is to pulled out the 5 alternate supplier NAMES...

there is no EXPRESSION for the 5 alternate COST fields, they are associated with the column names in the PRODUCT table.

i also keep getting this error everytime i open the report
1702065418133.png
 

plog

Banishment Pending
Local time
Today, 01:30
Joined
May 11, 2011
Messages
11,646
I think you need to put this report on hold and focus on fixing your tables. If you don't get that right you will continue to have to hack together and make things like this report (and forms) harder than they need to be.

I have a PRODUCT table that has a main supplier id and his cost and 5 alternate suppliers ids and their costs.

The data described just that one sentence requires at least 2 tables, not the one you have. PRODUCT would'nt hold all that supplier data, instead it would hold just data about the product. Then you would have another table called PRODUCT_SUPPLIERS which would hold the ProductID from PRODUCTS (you do have an autonumber primary key in PRODUCTS don't you?) as well as a field for SuppierID. Then when you had 6 suppliers who supplied a product you would add 6 recrods to PRODUCT_SUPPLIERS (one for each supplier) instead of 1 record with 6 fields for that data.

Tables should accomodate data vertically (with more records) and not horizontally (with more fields). There's lots of little rules like that and the entire process of setting up fields and tables properly is called Data Normalization:


That links a good start but I would also google a few tutorials, then apply what you learn to your data. When done, complete the Relationship Tool in Access and post a screenshot of it back here and we can validate that you have set up your tables correctly. Right now they are wrong.
 

Jker

New member
Local time
Today, 02:30
Joined
Dec 8, 2023
Messages
4
Hmmm,, not the help i was looking for.... When i initially designed the report yesterday, ex
everything worked perfect.... then today,,, that one feld is not printing , only in the HEADER section. I am not worried about the table design since this is a small local datatbase on a freinds computer and its not running a big corporate business.
 

jdraw

Super Moderator
Staff member
Local time
Today, 02:30
Joined
Jan 23, 2006
Messages
15,379
Since it's a small local database, it might be better to upload a copy so readers can see what you are dealing with in context. As plog advises, tables in an RDBMS are usually about 1 subject.

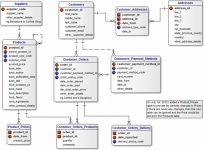
Here is a graphic of a data model showing an arrangement of tables and relationships supporting Customers Orders Products and Suppliers. (from Barry Williams' site ) The details are not meant to represent your situation, rather the graphic is to show tables (entities and their attributes) and how tables relate to one another based on business processes.

1702074433629.png
 

Users who are viewing this thread

Top Bottom