help needed with formatting charts

martinr

Registered User.
Local time
Tomorrow, 05:19
Joined
Nov 16, 2011
Messages
74
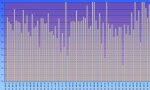
I have inserted a 2d column chart into a report and it looks fine, however when
it loads into 'print preview' or layout view only 12 of the 14 columns are visible (2 columns do not 'fit' into the chart).
I adjusted the column gap but it just makes all the columns wider and the gap between them narrower. What i need to do is also make the columns 'narrower' so they will all fit into the chart area.
is there a way to specify or adjust the column width independently to the gap width?
ps, this is using Access 2013
 
Sound strange, normally all columns are in the chart area, even when it is 50.
Could you post a sample database with the report and chart, and some sample data?
 
Thanks JHB,
it's quite a large database so I'll have to extract a 'lite' version that i can post for you -
it may take some time.
i had another look at the chart properties and saw one called 'size mode', so i will
also experiment with this. Maybe it has something to do with scaling that is not directly
specified(?)
 
If me, I would create a new report with a new chart in it.
If the object frame is smaller as the graph it self, then it could cause the problem you've.
attachment.php
 

Attachments

  • Graf.jpg
    Graf.jpg
    96.3 KB · Views: 235
Last edited:
thanks jhb for posting that!
did you have to specify the X axis labels to be vertical?
does your chart adjust/scale in size if you adjust your report
page setup size (ie, from A3 to A4)?
 
thanks jhb for posting that!
did you have to specify the X axis labels to be vertical?
Yes.
does your chart adjust/scale in size if you adjust your report
page setup size (ie, from A3 to A4)?
No you've to adjust the object frame and the graph object.
If the object frame is smaller as the graph it self, then it could cause the problem you've.
 

Users who are viewing this thread

Back
Top Bottom