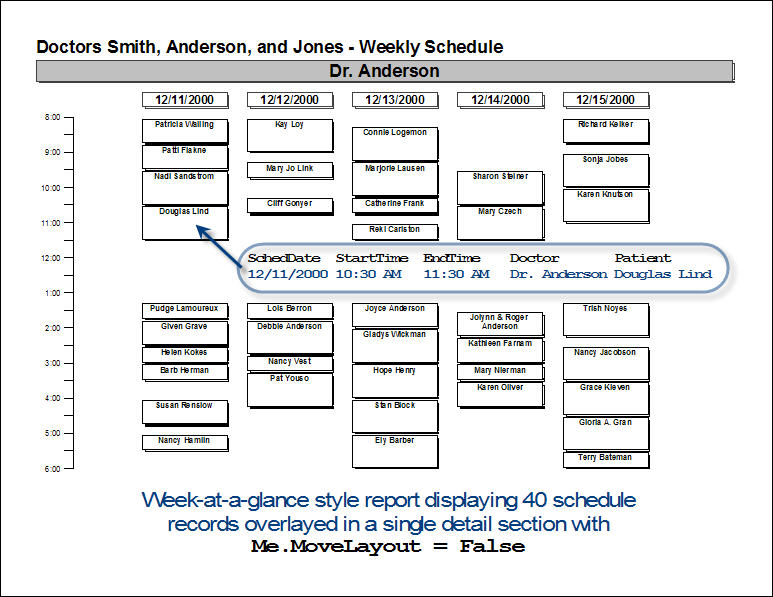
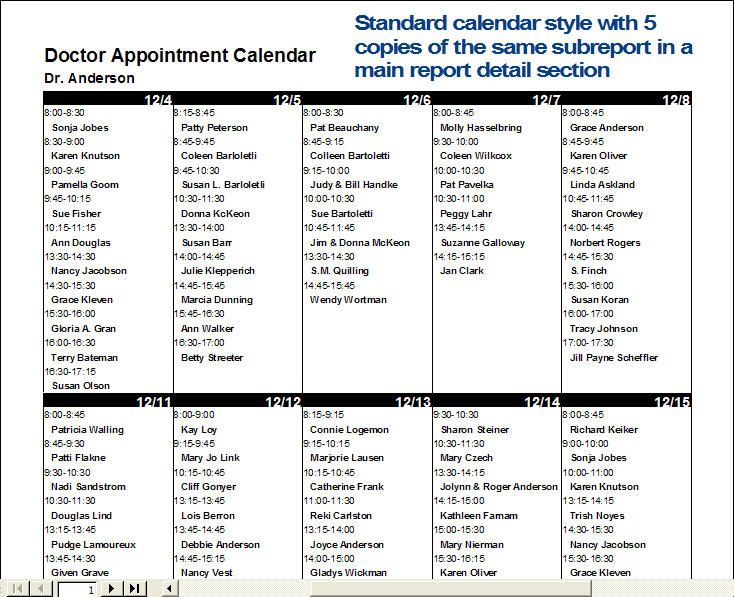
I am looking for information on creating a "Table" report. Meaning, I need my data to be presented within a table (visual presentation) - just like if you were to create it within a Microsoft Word document (with rows & columns). Ultimately, I want to be able to present information within the constraints of each square (…cell, quadrant). Is this something that can be accomplished within creating a Report.
Thank you
Thank you


