You are using an out of date browser. It may not display this or other websites correctly.
You should upgrade or use an alternative browser.
You should upgrade or use an alternative browser.
Graphical Reports (1 Viewer)
- Thread starter JMichaelM
- Start date
Quick answer is Yes.
Longer answer, you place controls (I prefer labels) on your report then use VBA based on totals to change the height and caption for the label. You can also add line controls and change their slant / top / height to give line graphs.
I'll resave in a little bit in an older format.
Longer answer, you place controls (I prefer labels) on your report then use VBA based on totals to change the height and caption for the label. You can also add line controls and change their slant / top / height to give line graphs.
I'll resave in a little bit in an older format.
Please see attached. One of the Bar chart examples isn't working and I haven't had a chance to figure out why yet. The other works fine for horizontal bar charts and shows about how to do these. The line chart and Gantt chart show how to pull off some neat tricks.
Attachments
OK, so I took a look- pretty intense. Thank you. What I'm trying to do is to create the pie from the data table, and have it with the labels, and percentages on a report. I'll use this as a stepping stone. If you have the time, a report demo would be helpful. A pivot pie can be created almost instantly and thereafter adding traditional labels, change colors. I'll give it a try this week.
I found this in a book which builds on your code:
PivotTables and PivotCharts
In previous versions, Access forms could be confi gured to show data in PivotTable and/or PivotChart
view, which was effective for displaying multi-dimensional data or for rendering aggregated data
in a visual manner. Both relied on Microsoft Offi ce Web Components, which has already been
deprecated in previous versions of Offi ce. Excel has since refi ned and enhanced its PivotTable/
PivotChart capabilities, but those enhancements aren’t available to Access directly.
To upgrade Access solutions that make use of PivotTables or PivotCharts, you have two possible
approaches:
1. Add an ActiveX control referencing “Microsoft Offi ce XX.0 PivotTable” and/or “Microsoft
Offi ce XX.0 Chart” where XX.0 may be either 10.0 or 11.0, and update all VBA references
to PivotTable/PivotChart events and properties from the form to the added ActiveX control.
2. Instead of rendering the data in Access, automate Excel to build a PivotTable and/or
PivotChart and use Offi ce
Reference:
Hennig, T.,Clothier, B., Hepworth, G., Yudovich D., 2013 Access Programming 2-13 Wrox Wiley & Sons
Missed a few lines:
In previous versions, Access forms could be confi gured to show data in PivotTable and/or PivotChart
view, which was effective for displaying multi-dimensional data or for rendering aggregated data
in a visual manner. Both relied on Microsoft Offi ce Web Components, which has already been
deprecated in previous versions of Offi ce. Excel has since refi ned and enhanced its PivotTable/
PivotChart capabilities, but those enhancements aren’t available to Access directly.
To upgrade Access solutions that make use of PivotTables or PivotCharts, you have two possible
approaches:
1. Add an ActiveX control referencing “Microsoft Offi ce XX.0 PivotTable” and/or “Microsoft
Offi ce XX.0 Chart” where XX.0 may be either 10.0 or 11.0, and update all VBA references
to PivotTable/PivotChart events and properties from the form to the added ActiveX control.
2. Instead of rendering the data in Access, automate Excel to build a PivotTable and/or
PivotChart and use Offi ce Data connection to enable Excel to query the data directly from
the source table/queries.
isladogs
MVP / VIP
- Local time
- Today, 05:04
- Joined
- Jan 14, 2017
- Messages
- 18,247
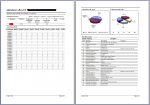
Same idea - this time on a report

EDIT:
Just read your quote from Access 2013 programming book
Pivot Charts / Tables were deprecated in access 2013
The examples I've shown were done in Access 2010 BUT do not use pivot charts
Recommend NOT using ActiveX if at all possible
Simple pie charts are all that is needed
EDIT:
Just read your quote from Access 2013 programming book
Pivot Charts / Tables were deprecated in access 2013
The examples I've shown were done in Access 2010 BUT do not use pivot charts
Recommend NOT using ActiveX if at all possible
Simple pie charts are all that is needed
Attachments
-
 Capture.PNG70.7 KB · Views: 211
Last edited:
isladogs
MVP / VIP
- Local time
- Today, 05:04
- Joined
- Jan 14, 2017
- Messages
- 18,247
Wow, it was kind of easy. Thanks for your support. Do any of you know how to do a data bar?
Does this link help?
https://support.office.com/en-gb/article/Display-comparative-data-visually-with-data-bars-1329c412-b6ce-427b-a5af-c49890667513
Mark - I found it was very good but hard to follow in terms of reports. I'll need a week to figure that out. Im just looking to apply bars to reports. I'm thinking the link will help and it is exactly what I need if it applies to 2013. I'll let you know how it goes.Thanks.
Similar threads
- Replies
- 15
- Views
- 465
Users who are viewing this thread
Total: 1 (members: 0, guests: 1)