Hello, I haven't had much time to work on this, but before I start the report I was talking about. I have the rptNSAByPlanWeek and am using John Accelerator in the example. This report is very similar to the Standard Actions by Plan Week report that you helped me with. The main difference is that we are summing the NSApoints in the Challenges table and then I need to total the weeks at the end of each row, which I'm stumped at how to make that happen. I am getting an error saying "You can't assign a value to this object." when I load the form, but when I push past it all the data is coming up right, except the Totals field that is not bound to anything right now. I attached an updated version of the program, let me know your thoughts. Thanks.
You are using an out of date browser. It may not display this or other websites correctly.
You should upgrade or use an alternative browser.
You should upgrade or use an alternative browser.
Need to print a crosstab report without complete data
- Thread starter Lkwdmntr
- Start date
DHookom
Active member
- Local time
- Today, 00:15
- Joined
- Aug 7, 2024
- Messages
- 346
Which "when I load the form"?
Do you actually mean the report "rptNonStandardActionsByPlanWeek"
The report errors but if you open the report in design view and display the record source in datasheet, you get

Is that what you expected? I found the last report I looked at worked if some the controls in the header were removed.
As the NFL referees say "After further review", you have code in the report that attempts to set the value of controls that have a value in the Control Source. You can't do this. You can set values of unbound controls.
Do you actually mean the report "rptNonStandardActionsByPlanWeek"
The report errors but if you open the report in design view and display the record source in datasheet, you get
Is that what you expected? I found the last report I looked at worked if some the controls in the header were removed.
As the NFL referees say "After further review", you have code in the report that attempts to set the value of controls that have a value in the Control Source. You can't do this. You can set values of unbound controls.
Last edited:
Yes, when I hit "Output" on the SelectLoopReport form. I took out the code, that wasn't needed. This one guy who was helping me a while back suggested using "con" as a variable type because the crosstabs didn't like the temp variables. Looks like I'm not using that anymore.
Ok, so that is working well and all the data is correct. I am stumped on how to make a totals column. I did try to add all the fields together but for some reason it worked on some, but not others. Any ideas?


Ok, so that is working well and all the data is correct. I am stumped on how to make a totals column. I did try to add all the fields together but for some reason it worked on some, but not others. Any ideas?
Last edited:
As far as the other report. You asked me to show you the query that pulls all the data. The report is Weekly Progress by Standard Action, and I am using twelve sub-reports to get all the data for all twelve weeks. The query is shown below. The issue is that I don't get all the labels if I add an action any time after week one. I also need a crosstab for this report, but Access has issues with too many rows for the data. HELP!

If you add a Null value to any other value, it will Null the result. For instance Null + 8 = Null. I expect you could just add another row heading like:
View attachment 118380
If you add a Null value to any other value, it will Null the result. For instance Null + 8 = Null. I expect you could just add another row heading like:
View attachment 118380
Wow! I didn't think it would be that easy. Nice fix. Now I have this other report that will probably not be so easy. I sent the query and some info in the last post. Thanks again for all your help, I don't know what I would do without you and this site.If you add a Null value to any other value, it will Null the result. For instance Null + 8 = Null. I expect you could just add another row heading like:
View attachment 118380
DHookom
Active member
- Local time
- Today, 00:15
- Joined
- Aug 7, 2024
- Messages
- 346
Access should never have “issues with too many rows”. There is a limit to the number of columns in a query which matches the limit of fields in a table.
Twelve queries for twelve weeks sounds like a poor design but I can’t tell since I’m replying from my iPad.
Twelve queries for twelve weeks sounds like a poor design but I can’t tell since I’m replying from my iPad.
It is a poor design, but making a crosstab for all those fields is beyond me, and that was the only way I could get it to work. But it doesn't work. If you have more time to take a look at it, I would greatly appreciate it.Access should never have “issues with too many rows”. There is a limit to the number of columns in a query which matches the limit of fields in a table.
Twelve queries for twelve weeks sounds like a poor design but I can’t tell since I’m replying from my iPad.
DHookom
Active member
- Local time
- Today, 00:15
- Joined
- Aug 7, 2024
- Messages
- 346
Having 12 queries with basically the same SQL and only a slight difference in criteria raises questions. I can't figure out what you are attempting to do. I rarely if ever use tempvars and global variables and when I do, they are documented. They all make any troubleshooting very troublesome. Also, modal forms don't allow for moving between objects.
I have no idea what you want in your report.
I have no idea what you want in your report.
Hi, I am sorry this isn't easier to understand. Let me try again.
With this report, I am pulling the points earned throughout the weeks of the program. The points are put in with the "Enter User's Progress" button on the Main Menu and filling out those forms. The report lists planned points, engagement points, and achievement points. You can see the logic in the "qlkpPoints" query.
I find the potential points (Planned in the report) for each Start Time action by looking at the Start Time. If it is not null, there is a point. Same thing with the Activity Action, but if IsActivity is selected, then there is a point. Then, if checks are in the "Yes" or "No" field, they earn an Engagement point. If they check "Yes" it counts as an Achievement point. The potential (Planned) points reflect the maximum number of points that can be earned for both Engagement and Achievement actions.
I can gather this information each week with the query "qlkpStandardActionPoinstbyLoop_Wk_XX." I don't know how to do it for the whole loop and present it as a crosstab report.
I wish this weren't so challenging. I feel bad that I keep asking you for help. I'm not opposed to offering some payment to help with this either. Let me know if that is appropriate in this case.
I am also willing to meet via Teams or Zoom to help better explain.
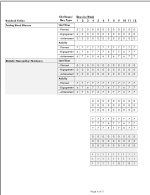
I attached a couple of screenshots. One shows where the data is being entered, and the other is the actual report where the action was added after the first week.
With this report, I am pulling the points earned throughout the weeks of the program. The points are put in with the "Enter User's Progress" button on the Main Menu and filling out those forms. The report lists planned points, engagement points, and achievement points. You can see the logic in the "qlkpPoints" query.
I find the potential points (Planned in the report) for each Start Time action by looking at the Start Time. If it is not null, there is a point. Same thing with the Activity Action, but if IsActivity is selected, then there is a point. Then, if checks are in the "Yes" or "No" field, they earn an Engagement point. If they check "Yes" it counts as an Achievement point. The potential (Planned) points reflect the maximum number of points that can be earned for both Engagement and Achievement actions.
I can gather this information each week with the query "qlkpStandardActionPoinstbyLoop_Wk_XX." I don't know how to do it for the whole loop and present it as a crosstab report.
I wish this weren't so challenging. I feel bad that I keep asking you for help. I'm not opposed to offering some payment to help with this either. Let me know if that is appropriate in this case.
I am also willing to meet via Teams or Zoom to help better explain.
I attached a couple of screenshots. One shows where the data is being entered, and the other is the actual report where the action was added after the first week.
Attachments

Last edited:
Yes, because of the points. Not only are they being calculated on the form, but they are also being stored for tracking. They get points for checking the yes and no fields and then another point if its a yes.
I just left for a week vacation with only phone and iPad. I’ll have to look at this in a week or so. Is there a good reason why there activity yes and activity no fields rather than a single field
What can I do to help you understand this better? I, too, have struggled with this. The person who came up with this idea approached me a long time ago. I genuinely think this is more of a hobby for her. I have been working slowly on this application for years and she keeps finding things to add or change. She is a wonderful person, and I love working with her, but I don't think this will ever really go that far. I am just trying to give her life some purpose with these hopes of hers.
You can let me know what I can do to help you understand this program so I can finish this report for her. I want a complete program for her and hopefully pass this on to someone else. I have a full-time job that I need to focus on, and I can't do a whole lot for her going forward. I'm just trying to finish what we started.
I hope you can understand my dilemma.
The points are all about accountability. After reading the one comment I sent you, I can understand the confusion. I had to understand this a long time ago, but I do remember how confusing it was when we first started. When the client is filling out their reporting form, whether they complete the task or not (marking yes or no) makes them accountable and helps them grow. We can show them their progress with the reports and where they need improvement. This program is all about establishing lifestyle changes to be a healthier person, as well as reversing their diabetes or any of the other issues this program can help with.
I think that was a little clearer. Let me know if you still need help understanding this process.
I think that was a little clearer. Let me know if you still need help understanding this process.
I want you to know how grateful I am for all the help you have given me over the last weeks and months. You have saved me numerous times and I know this most recent problem has been a problem.
If you cannot help, I understand. Otherwise, I would genuinely appreciate the opportunity to explain the problem to you differently.
Please let me know either way, and remember I am open to a phone call or screen share to help explain things better.
Thank you!
If you cannot help, I understand. Otherwise, I would genuinely appreciate the opportunity to explain the problem to you differently.
Please let me know either way, and remember I am open to a phone call or screen share to help explain things better.
Thank you!
DHookom
Active member
- Local time
- Today, 00:15
- Joined
- Aug 7, 2024
- Messages
- 346
You need to provide a query with columns for every value you want to display in your report. It should be a totals query that is grouped by the date, as well as the fields you expect to see on the left side of the page. There should be one column that totals the numeric value.

Similar threads
- Replies
- 11
- Views
- 375
- Replies
- 10
- Views
- 190
Users who are viewing this thread
Total: 1 (members: 0, guests: 1)